






7537
Of your peers have already downloaded this article
15:52 Minutes
The most insightful time you'll spend today!
Make Meaningful Analysis with Geo Boundary Public Datasets on BigQuery

6351
Of your peers have already read this article.
4:00 Minutes
The most insightful time you'll spend today!
Geospatial data is a critical component for a comprehensive analytics strategy. Whether you are trying to visualize data using geospatial parameters or do deeper analysis or modeling on customer distribution or proximity, most organizations have some type of geospatial data they would like to use – whether it be customer zipcodes, store locations, or shipping addresses. However, converting geographic data into the correct format for analysis and aggregation at different levels can be difficult. In this post, we’ll walk through some examples of how you can leverage the Google Cloud platform alongside Google Cloud Public Datasets to perform robust analytics on geographic data. The full queries can be accessed from this notebook here.
Public US Geo Boundaries dataset
BigQuery hosts a slew of public datasets for you to access and integrate into your analytics. Google pays for the storage of these datasets and provides public access to the data via the bigquery-public-data project. You only pay for queries against the data. Plus, the first 1 TB per month is free! These public datasets are valuable on their own, but when joined against your own data they can unlock new analytics use cases and save the team a lot of time.
Within the Google Cloud Public Datasets Program there are several geographic datasets. Here, we’ll work with the geo_us_boundaries dataset, which contains a set of tables that have the boundaries of different geospatial areas as polygons and coordinates based on the center point (GEOGRAPHY column type in BigQuery), published by the US Census Bureau.

Mapping geospatial points to hierarchical areas
Many times you will find yourself in situations where you have a string representing an address. However, most tools require lat/long coordinates to actually plot points. Using the Google Maps Geocoding API we can convert an address into a lat/long and then store the results in the BigQuery table.
With a lat/long representation of our point, we can join our initial dataset back onto any of the tables here using the ST_WITHIN function. This allows us to check and see if a point is within the specified polygon.
ST_WITHIN(geography_1, geography_2)
This can be helpful for ensuring standard nomenclature; for example, metropolitan areas that might be named differently. The query below maps each customers’ address to a given metropolitan area name.
SELECTcust.id as customer_id,metro.name as metro_nameFROM `looker-private-demo.retail.customers` as cust,`bigquery-public-data.geo_us_boundaries.metropolitan_divisions` as metroWHERE ST_WITHIN(ST_GEOGPOINT(cust.longitude, cust.latitude),metro.metdiv_geom)
It can also be useful for converting to designated market area (DMA), which is often used in creating targeted digital marketing campaigns.
SELECTcust.id as customer_id,dma.dma_nameFROM `looker-private-demo.retail.customers` as cust,`bigquery-public-data.geo_us_boundaries.designated_market_area` as dmaWHERE ST_WITHIN(ST_GEOGPOINT(cust.longitude, cust.latitude),dma.dma_geom)
Or for filling in missing information; for example, some addresses may be missing zip code which results in incorrect calculations when aggregating up to the zipcode level. By joining onto the zip_codes table we can ensure all coordinates are mapped appropriately and aggregate up from there.
SELECTzip.zip_code,count(distinct cust.id) as unique_customersFROM `looker-private-demo.retail.customers` as cust,`bigquery-public-data.geo_us_boundaries.zip_codes` as zipWHERE ST_WITHIN(ST_GEOGPOINT(cust.longitude, cust.latitude),zip.zip_code_geom)GROUP BY 1
Note that the zip code table isn’t a comprehensive list of all US zip codes, they are zip code tabulation areas (ZCTAs). Details about the differences can be found here. Additionally, the zip code table gives us hierarchical information, which allows us to perform more meaningful analytics. One example is leveraging hierarchical drilling in Looker. I can aggregate my total sales up to the country level, and then drill down to state, city and zipcode to identify where sales are highest. You can also use the BigQuery GeoViz tool to visualize geospatial data!

Aside from simply checking if a point is within an area, we can also use ST_DISTANCE to do something like find the closest city using the centerpoint for the metropolitan area table.
SELECTcust.id as customer_id,ARRAY_AGG(metro.name order by ST_DISTANCE(ST_GEOGPOINT(cust.longitude, cust.latitude),metro.internal_point_geom) asc limit 1)[offset(0)] as metro_nameFROM`looker-private-demo.retail.customers` as cust,`bigquery-public-data.geo_us_boundaries.metropolitan_divisions` as metroGROUP BY cust.id
This concept doesn’t just hold true for points, we can also leverage other GIS functions to see if a geospatial area is contained within areas that are listed in the boundaries datasets. If your data comes into BigQuery as a GeoJSON string, we can convert it to a GEOGRAPHY type using the ST_GEOGFROMGEOJSON function. Once our data is in a GEOGRAPHY type we can do things like check to see what urban area the geo is within – using either ST_WITHIN or ST_INTERSECTS to account for partial coverage. Here, I am using the customer’s zip code to find all metropolitan divisions where the zip code polygon and the metropolitan polygon intersect. I am then selecting the metropolitan area that has the most overlap (or the intersection has the largest area) to be the customer’s metro that we use for reporting.
SELECTcust.id as customer_id,ARRAY_AGG(metro.name order by ST_AREA(ST_INTERSECTION(zip.zip_code_geom,metro.metdiv_geom)) desc limit 1)[offset(0)] as metro_nameFROM`looker-private-demo.retail.customers` as custJOIN `bigquery-public-data.geo_us_boundaries.zip_codes` as zip on cust.zip=zip.zip_code,`bigquery-public-data.geo_us_boundaries.metropolitan_divisions` as metroWHERE ST_INTERSECTS(zip.zip_code_geom,metro.metdiv_geom)GROUP BY cust.id
The same ideas can be applied to the other tables in the dataset including the county, urban areas and National Weather Service forecast regions (which can also be useful if you want to join your datasets onto weather data).
Correcting for data discrepancy
One problem that we may run into when working with geospatial data is that different data sources may have different representations of the same information. For example, you might have one system that records state as a two letter abbreviation and another using the full name. Here, we can use the state table to join the different datasets.
SELECTst.state_name,sum(ab.sales+fn.sales) as total_salesFROM `bigquery-public-data.geo_us_boundaries.states` as stLEFT JOIN abbreviated_table as ab on ab.state = st.stateLEFT JOIN fullname_table as fn on fn.state = st.state_nameWHERE COALESCE(ab.state, fn.state) IS NOT NULLGROUP BY 1
Another example might be using the tables as a source of truth for fuzzy matching. If the address is a manually entered field somewhere in your application, there is a good chance that things will be misspelled. Different representations of the same name may prevent tables from joining with each other or lead to duplicate entries when performing aggregations. Here, I use a simple Soundex algorithm to generate a code for each county name, using helper functions from this blog post. We can see that even though some are misspelled they have the same Soundex code.

Next, we can join back onto our counties table so we make sure to use the correct spelling of the county name. Then, we can simply aggregate our data for more accurate reporting.
SELECTc.county_name,sum(sales) as total_salesFROMtableJOIN `bigquery-public-data.geo_us_boundaries.counties` as con testing.dq_fm_Soundex(table.county) = testing.dq_fm_Soundex(c.county_name)WHERE c.state_fips_code = cast(36 as string)GROUP BY 1
Note that fuzzy matching definitely isn’t perfect and you might need to try different methods or apply certain filters for it to work best depending on the specifics of your data.
The US Geo Boundary datasets allow you to perform meaningful geographic analysis without needing to worry about extracting, transforming or loading additional datasets into BigQuery. These datasets, along with all the other Google Cloud Public Datasets, will be available in the Analytics Hub. Please sign up for the Analytics Hub preview, which is scheduled to be available in the third quarter of 2021, by going to g.co/cloud/analytics-hub.
Serverless and BigQuery Together on Google Cloud: Behind the L’Oreal Beauty Tech Data Platform

5355
Of your peers have already read this article.
4:00 Minutes
The most insightful time you'll spend today!
Editor’s note: In Today’s guest post we hear from beauty leader L’Oréal about their approach to building a modern data platform on fully managed services: managing the ingest of diverse datasets into BigQuery with Cloud Run, and orchestrating transformations into relevant business domain representations for stakeholders across the organization. Learn more about how businesses have benefited from Cloud Run in Forrester’s report on Total Economic Impact.
L’Oréal was born out of science. For over 100 years, we have always shaped the future of beauty, and taken its eternal quest to new horizons. This has earned us our current position as the world’s uncontested beauty leader (~€ 32 B annual sales in 2021), present in 150 countries with over 85,000 employees.
Today, with the power of our game-changing science, multiplied by cutting-edge technologies, we continue our lifelong journey of shaping the future of beauty.
As a Beauty Tech company, we leverage our decades-long heritage of rich data assets to empower our decision-making with instant, sophisticated analysis.
Because we oversee global brands, which must adapt to local requirements, we need to maintain a deep understanding of what a brands’ data represents, while managing disparate legal and regulatory requirements for different countries. Our end goal is to run a safe, compliant and sustainable data warehouse as efficiently and effectively as possible.
We sync and aggregate internal and external data from a wide variety of sources across organizations and retail stores. This made the management of our data warehouse infrastructure used to be very complex and hard to manage before Google Cloud. L’Oréal’s footprint was so large that we once found it impossible to have a standardized method to handle data. Every process was vendor-specific, and the infrastructure was brittle. We went looking for a solution to our complex data infrastructure needs, and defined the following non-negotiable principles:
- No Ops: The job of a developer at L’Oréal is not to manage servers. We need an elastic infrastructure that scales on demand, so that our developers can focus on delivering customized and inclusive beauty experiences to all consumers, rather than focusing on managing servers.
- Secure: We have strict security and compliance requirements which vary by country, and we employ a zero-trust security strategy. We must keep both our own internal data and customer data safe and encrypted.
- Sustainable : Our data lives in multiple environments, including on-prem data centers and public cloud services. We must be able to securely access and analyze this data while minimizing the complexity and environmental impact of moving and duplicating data.
- End-to-end supervision: Because developers shouldn’t be managing servers, we need a “single pane of glass” dashboard to monitor and triage the system if something goes wrong.
- Easy-to-deploy: Deploying code safely should not compromise velocity. We are constantly developing innovations that push the boundaries of science and reinvent beauty rituals. We need integrated tools to make our code deployment process seamless and safe.
- Event-driven architecture: Our data is used globally by research, product, business and engineering teams with high expectations on data quality and timeliness. Many of our internal processes and analysis are based on near real-time data.
- Data products delivered “as a service”: We want to empower our employees to drive business value at record speed. To that end, we need solutions that enable us to remove the developers from the critical path of solution delivery as much as possible.
- Extract-load-transform (ELT): Our goal is to implement the pattern to load data as soon as possible into the data warehouse to take advantage of SQL transformations.
After considering multiple vendors on the market, with these principles in mind, we landed on end-to-end Google Cloud serverless and data tooling. We were already using Google Cloud for a few processes, including BigQuery, and loved the experience.
We’ve now expanded our use of Google Cloud to fully support the L’Oréal Beauty Tech Data Platform.
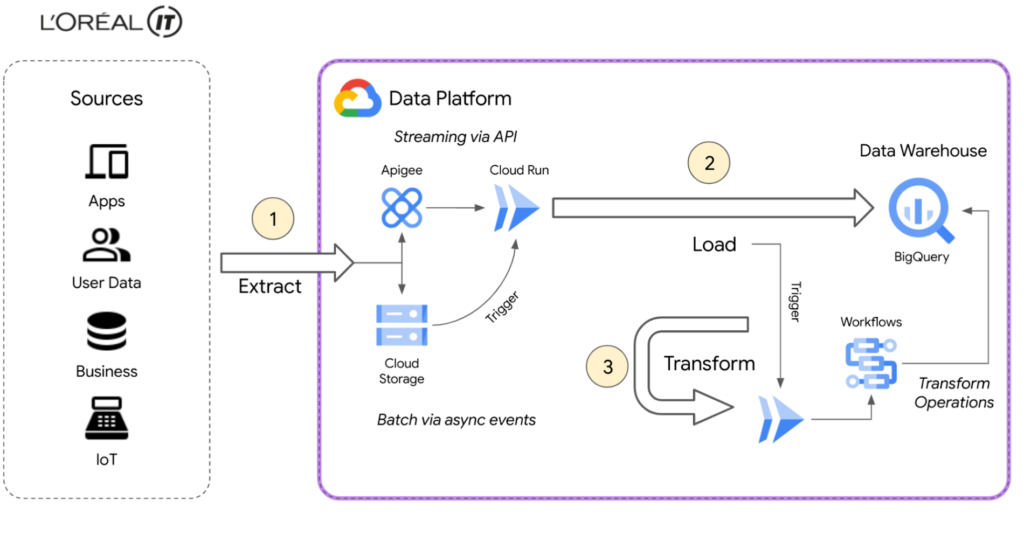
L’Oréal’s Beauty Tech Data Platform incorporates data from two types of sources: directly via API, which is data that adapts easily to our schema and is inserted directly into BigQuery, and bulk data from integrations, which require event-driven transformations using Eventarc mechanisms. These transformations are performed in Cloud Run and Cloud Functions (2nd gen), or directly in SQL. With Google Cloud, we can adapt very quickly.
Today, we currently have 8500 flows for ~5000 users using the native zero-trust capabilities offered by Google Cloud. Indeed, the flows come from Google Cloud and other third-party services.
BigQuery enabled us to adopt standard SQL as our universal language in our data warehouse and meet all expectations for queries and reporting. We were also able to load original data using features like federated queries, and efficiently transitioned from ETL to ELT data ingestion by handling semi-structured data with SQL. This approach of loading original data from sources into BigQuery with non-destructive transformations allows us to reprocess data for new use-cases easily, directly within BigQuery.
Our applications are hosted on multiple environments – on-premises, in Google Cloud, and in other public clouds. This made it difficult for our data engineers and analysts to natively analyze data across clouds until we started using BigQuery Omni. This capability of BigQuery allowed us to globally access and analyze data across clouds through a single pane of glass using the native BigQuery user interface itself. Without BigQuery Omni, it would’ve been impossible for our teams to natively do cross-cloud analytics. Moreover, it eliminated the need for us to move sensitive data, which is not only expensive because of local tax and subsea transport, but also incredibly risky – sometimes even forbidden – because of local regulations.
Today Google Cloud powers our Beauty Tech Data Platform, which stores 100TB of production data in BigQuery and processes 20TB of data each month. We have more than 8000 governed datasets, and 2 millions of BigQuery tables coming from multiple data sources such as Salesforce, SAP, Microsoft, and Google Ads.
For more complex transformations where custom and specific libraries are required, Cloud Workflows help us to manage the complexity very efficiently by orchestrating steps in containers through Cloud Run, Cloud Functions and even BigQuery jobs — the most used way to transform and add value to the L’Oréal data.
Additionally, by using BigQuery and Google Cloud’s serverless compute for API ingestion, bulk data loading, and post-loading transformations, we can keep the entire system in a single boundary of trust at a fraction of the cost. With ingest, queries, and transformations all being fully elastic and on-demand, we no longer have to perform capacity planning for either the compute or analytics components of the system. And of course these services’ pay-as-you-go model perfectly aligns with L’Oréal’s strategy of only paying for something when you use it.
Google Cloud fulfilled the requirements of our Beauty Tech Data Platform. And as if offering us a no-ops, secure, easy-to-deploy, custom-development free, event-based platform with end-to-end supervision wasn’t enough, Google Cloud also helped us with our sustainability efforts.
Being able to measure and understand the environmental footprint of our public cloud usage is also a key part of our sustainable tech roadmap. With Google Cloud Carbon Footprint, we can easily see the impact of our sustainable infrastructure approach and architecture principles. Our Beauty Tech platform is a strategic ambition for L’Oréal: inventing the beauty products of the future while becoming the company of the future.
Sustainable tech is an imperative and a very important step towards this ambition of creating responsible beauty for our consumers, and sustainable-by-design tech services for our employees. We all have a role to play, and by joining forces, we can have a positive impact.
Google Cloud’s data ecosystem and serverless tools are highly complementary, and made it possible to build a next-generation data analytics platform that met all our needs.
Get started using serverless and BigQuery together on Google Cloud today.
3173
Of your peers have already watched this video.
23:00 Minutes
The most insightful time you'll spend today!
Best Practices from Experts to Maximize BigQuery Performance (Featuring Twitter)
If you have made the decision to run your data analytics on BigQuery’s serverless platform, you are in good company.
Now, as you deploy complex workloads on your data, you want to be able to maximize the performance of all data operations from data loading to data analytics.
In this video Jagan Athreya, Product Manager, Google Cloud and Gary Steelman, Senior Software Engineer, Twitter discuss the best practices from speeding up your data ingest into BigQuery to learning the tips and tricks from the BigQuery engineering team to maximize query performance of your data warehouse.
The session is roughly divided into five areas:
- The architecture that enables the performance of BigQuery
- An example of a typical query
- How to write fast and efficient queries
- The best way to ingest data
- Twitter case study
AgroStar: Small farms in India getting big help from the cloud

13254
Of your peers have already read this article.
3:30 Minutes
The most insightful time you'll spend today!
AgroStar has launched a cloud-based mobile app that is helping to boost crop yields and encourage best practices for small farmers in India. Launched as an on-premises ecommerce platform selling farm tools in 2008, the firm turned to Google Cloud Platform (GCP) to expand its offering. It now uses cloud-based analytics and is deploying ML models to provide timely advice in five languages on everything from seed optimization, crop rotation, and soil nutrition to pest control.
A 2018 survey underscored the demand for agricultural planning for Indian farmers. While farming remains a dominant sector in India, employing half of its labor force, 70 percent of small farmers – those cultivating fewer than three acres – said their crops are damaged by unforeseen weather and pests. An even higher number – 74 percent – say they lack access to farming-related information.
Widening that gap is the relative lack of access to new, higher yield seeds and improved soil analyses for small farmers, who must otherwise rely on traditional methods. “It could take a few years for innovative information to trickle down from universities to small, grassroots farmers,” says Pritesh Gudge, AgroStar Software Engineer. “Today, just by clicking through our Android application, farmers learn about new, effective farming practices and receive advice customized to their crop and soil.”
Connecting a million farmers in the cloud
Operating in the Indian states of Gujarat, Maharashtra, Rajasthan, Orissa, Bihar, and Karnataka, AgroStar is closing the knowledge gap with a full-service, cloud-based SaaS solution – the only one of its kind in India. It combines agronomy, data science, and analytics to help farmers by providing a variety of resources.
AgroStar has reached over a million farmers through its Android app, the AgroStar Agri-Doctor. The mobile client is available as a web-based or full-featured native app. Both provide access to the firm’s knowledge base hosted on GCP, a Q&A forum that connects farmers to each other to help understand and better solve problems and to learn about innovative practices and products. Farmers can also click through to follow local and national market trends that help forecast crop prices.
In addition to the self-service knowledge base, AgroStar provides access to agronomy experts who use cloud-based analytics tools and historical data to provide season-and locale-specific advice to each farmer. “We are now tracking thousands of calls in 5 languages each day,” says Pritesh.
The AgroStar app also provides links to purchase and then track the delivery of farm tools and supplies such as cultivators and fertilizers. An in-house platform manages fulfillment centers and a doorstep delivery network simplifies the supply chain while giving farmers what they need, when they need it. By procuring directly from the manufacturers and primary distributors of farm supplies, Agrostar is achieving cost savings, which it passes on to farmers.
Build fast, pivot faster
From the start, the human and environmental variables of farming in India, not to mention the volume of AgroStar’s few hundred thousand monthly active users, made a highly scalable cloud-based solution inevitable. Farmers rely on the firm’s Agri-Doctor app to provide advice in multiple languages on topics that range widely throughout three growing seasons, each with distinct crop nutrition and rotation cycles and farm implementation requirements.
“For farmers, the focus keeps changing every month, and every season,” says Pritesh. “To serve our growing community, we needed a platform that could process images at high volume, fulfill tools and seed orders across thousands of miles, and respond to multilingual queries. We quickly moved away from spreadsheets and server-based solutions – we needed to build fast and pivot faster.”
Ending late-night deployments
The firm’s first cloud experience was with an AWS solution. At the time, AWS was the only cloud provider in India, but AgroStar wanted to find a solution that was easier to use and offered better integration with Android devices. “Deployment and processing costs were very high, and the developer tools and documentation were not as intuitive as we needed,” says Pritesh.
When GCP service arrived in India in October 2017, AgroStar embarked on a platform re-implementation that made possible dramatic changes in the way it developed and deployed its solution. Using Google Kubernetes Engine (GKE) for crop advice management and Compute Engine for its production application services, the firm built the backend for the Agri-Doctor discussion forum in only three weeks. The platform’s microservice architecture is implemented in Python and Golang and deployed on GCP.
AgroStar began to realize significant efficiencies in its build, deploy, and test cycles. “We previously needed to work overnight to deploy to production,” says Pritesh. “Now using Google for Kubernetes containers and a rolling update strategy, we can deploy during the day without any problems or interruptions to service.”
The move to GCP streamlined AgroStar’s stack. “We were running 12 independent instances on AWS,” says Pritesh. “With Google Kubernetes Engine, we are deployed on a single cluster at a cost savings of $1,300 per month and growing.”
Improving customer response times by 85 percent
With a managed deployment capability, AgroStar can devote more time and resources to executing on its platform and Agri-Doctor app development plan. A strategic goal was managing customer response times as the firm grew its base. GCP has helped the firm meet that goal, achieving an 85 percent improvement in customer response times even as traffic grew significantly.
“With our on-premises solution, we could handle around 100 customers daily, which took 30 to 50 minutes for each customer,” says Pritesh. “We now handle thousands of customers daily, taking only 4 to 5 minutes for each one.”
AgroStar used Firebase to implement its Agri-Doctor app. A real-time cloud database, Firebase provides an API that enables the Agri-Doctor advice forum to be synchronized across all its far-flung mobile clients, effectively sharing knowledge base updates with one million users in near real time.
Using cloud tools to manage and monitor
Cloud Pub/Sub, Kafka, and Cloud Dataflow manage data ingestion and queueing of event and transaction data to the analytics layer. BigQuery fetches and persists data to Cloud Storage. Cloud SQL and dashboards powered by Tableau deliver farmer crop and soil profiles within minutes.
Cloud IAM helps AgroStar control access to all its cloud resources. And Stackdriver, the integrated logging aggregation capability for GCP, helps monitor and speed debugging on every tier of the AgroStar solution.
Machine learning to enhance yields
AgroStar is developing a variety of ML components to improve responsiveness and extend its platform offerings.
To speed up the diagnosis of and treatment for crop blight, AgroStar is building a deep learning pipeline using TensorFlow. The pipeline relies on GoogLeNet models that use multi-layered convolutional visual pattern recognition. It will assess uploaded images to support a disease-detection capability on the mobile app. Based on the commercially successful AI algorithms that automated postal code processing, GoogLeNet offers improved performance and computational efficiencies by using a creative layering technique that distinguishes them from older, sequential recognition engines.
To improve its customer search experience, AgroStar is developing an ML pipeline that shrinks fetch times by suggesting tags mapped to stored data. Processed using TPUs, Cloud Natural Language and Video AI, the tags provide a metadata layer that supports queries in any of the ten natural languages that AgroStar farmers can use.
The AgroStar search pipeline consists of Long Short-Term Memory (LSTM) models of Recurrent Neural Networks. Recurrent networks exhibit “memory” through iterative processing and are distinguished from feedforward networks by a feedback loop connected to their past decisions, ingesting their own outputs moment after moment as input.
Implementing a recommendation engine
The firm is also adapting the Random Forests TensorFlow AI model to develop a crop and product recommendation engine. The model is trained by consuming numerical (rainfall, humidity, water availability per acre) and categorical (soil type, water sources) parameters to suggest appropriate products by season, region, and locale.
To simplify the product suggestion experience, AgroStar developers are testing Cloud Dialogflow, the Google Cloud conversational interface, to build a chatbot capability into its mobile app. The bot will track a farmer’s crop schedules and answer simple questions by linking to the recommendation engine.
AgroStar is also extending its analytics platform with AI-powered sales planning and forecasting. Using linear regression models implemented in TensorFlow and powered by Cloud ML Engine, the capability will enhance supply chain logistics as the company scales its operations across India.
To provide a credit on-demand offering for a range of seed-to-harvest cycle products, AgroStar is attempting to use Vision API to create an AI model that will convert uploaded photos of customer application records into standard data formats. The firm’s credit policy features a grace period in which farmers begin paying back loans after harvested crops go to market.
A versatile and friendly development ecosystem
AgroStar credits the convivial tools and documentation that GCP offers and its incremental, pay-as-you-go pricing model for both the firm’s success and its ability to manage growth.
“What Google Cloud offers is extremely good documentation and extremely simple-to-use tools and interfaces across all services,” says Pritesh. “It helped us initially deploy our platform and at every scale that we have required since then, and its cost effectiveness enabled us to staff up to meet new feature milestones.”
Mid-Sized B2B Firm Achieves the Business Trifecta with a Single Strategy

6912
Of your peers have already read this article.
2:45 Minutes
The most insightful time you'll spend today!
Thirteen years’ experience in e-commerce has given Teddy Chan, Chief Executive Officer and Chief Technology Officer, AfterShip, a deep understanding of the challenges of shipping and tracking packages to customers worldwide.
“The key problem many merchants face is customers asking ‘where is my order?’ and ‘when I will get the package?’” Chan says. “When I considered this issue, I came up with the idea of AfterShip.” Chan helped found AfterShip in 2011 to enable merchants to keep track of packages sent to customers via a web portal or an API. AfterShip also allows merchants to notify customers of anticipated delivery times.
“Using AfterShip, merchants can provide the same experience to buyers regardless of which couriers they use,” Chan says. “Merchants can also improve their customer engagement by including up-selling or marketing content with their delivery notifications.”
Hong Kong-headquartered AfterShip continues to grow quickly and now has a 40-person team. Thirty members of this team are based on the China special administrative region and 10 are based in India.
“Google Cloud Platform has a network of global datacentres with deep connectivity that enables us to put our infrastructure close to our customers. In addition, the ability to horizontally scale our global database using tools such as Google Cloud Spanner eliminates any limits on our geographic expansion.”
—Teddy Chan, Chief Executive Officer and Chief Technology Officer, AfterShip
By October 2017, the business was tracking about 30 million packages per month and had expanded its services to include label and rate calculation and self-service return. Revenue, package transaction numbers and team size have doubled every year for the past three years, while more than 300,000 merchants and 426 couriers are signed up to the service. Key customers include Wish, Etsy and Groupon.
Close to half AfterShip’s customers are based in the United States, about one third in Europe and the remainder are located in Asia. AfterShip had initially delivered its applications and services from an incumbent public cloud service. However, the company wanted to continue its growth trajectory while automating key infrastructure processes, implementing a continuous deployment model and controlling costs.
The business needed to achieve these objectives while maintaining a global presence and high-quality service. AfterShip started reviewing its options and decided to migrate to Google Cloud Platform (GCP). “Google Cloud Platform has a network of global datacentres with deep connectivity that enables us to place our infrastructure close to our customers,” Chan says.
“In addition, the ability to horizontally scale our global database using tools such as Google Cloud Spanner eliminates any limits to our geographic expansion. Furthermore, the managed services provided through GCP would allow us to focus on building better features for online merchants.” The reliability provided by GCP would also enable AfterShip to meet the stringent service level requirements of large digital marketplaces in the United States, Asia and elsewhere.
“Google Cloud Platform could manage the high volumes and enable us to deliver the service levels that would realise our ambition of becoming the number one tracking API platform in the world,” Chan says. “For example, with Google Cloud Platform, we can provide a 99.95% monthly uptime service level to our customers.” Finally, GCP provided managed solutions, including Google Kubernetes Engine powered by open source container orchestrator Kubernetes, that would enable AfterShip to automate processes such as scaling and enable its team to focus on developing applications.
AfterShip has moved its websites into GCP infrastructure in three datacentres around the world and anticipates completing the migration in Q4 2017. “Google provided a lot of assistance, particularly early in the project when we needed it,” Chan says. “They briefed us on several services we hadn’t known about that could replace the equivalents in the public cloud we were using previously.” The business then completed the migration using its own skilled team members. As well as Google Kubernetes Engine and Google Cloud Spanner, AfterShip is using Google BigQuery to store and analyse transaction information.
“Google Cloud Platform could manage the high volumes and enable us to deliver the service levels that would realise our ambition of becoming the number one tracking API platform in the world.”
—Teddy Chan, Chief Executive Officer and Chief Technology Officer, AfterShip
Deployment times down from one hour to two minutes
With deployment times falling from up to one hour in its previous cloud environment to about two minutes in GCP, AfterShip has been able to adopt a continuous deployment model. “This has improved our service levels,” Chan says. “If there are any issues we can fix them quickly, while we can iterate faster to create new features in response to customer requests or changes in the market. “This enables us to continue to lead our competitors.”
Targeting a 30 percent reduction in costs
AfterShip is now targeting a 30% reduction in costs by optimising its use of Docker containerisation technology on GCP.
“By using Docker with Kubernetes, we have been able to fine-tune our use of compute resources and better control our costs,” Chan says. “We’re extremely pleased with Google Cloud Platform as it really is built for engineers,” he adds. “In addition, its documentation is extremely clear, allowing us to troubleshoot or carry out activities on the platform ourselves. “We look forward to continuing to grow and extend our package tracking and associated services with Google Cloud Platform.”
More Relevant Stories for Your Company


Chronicle Security Analytics: Key to Address Security Data Overload
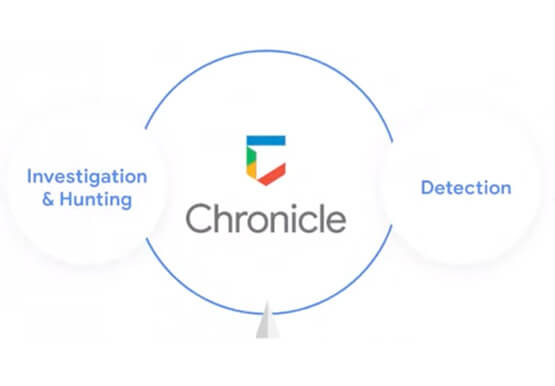
Google Cloud's Chronicle is a security analytics platform built for modern use cases to combat modern threats. In today's world, enterprises have undergone significant changes in all aspects, and must adapt to their security needs to counter threats and attacks. Watch the video to learn Google Cloud's initiative to help

ActivStat: Enhancing Live Sports Broadcast with Real-time Stats and Metrics
Millions of people annually view esports, as top players and teams compete in thrilling, fast-paced tests of reflexes, strategy, and teamwork. Fans are a diverse group, sharing a passion for action. A new, revolutionary project we’re working on with Call of Duty League just made that action a lot better.

A Breakdown of Cloud-based Data Ingestion Practices
Businesses around the globe are realizing the benefits of replacing legacy data silos with cloud-based enterprise data warehouses, including easier collaboration across business units and access to insights within their data that were previously unseen. However, bringing data from numerous disparate data sources into a single data warehouse requires you

How the City of Memphis Uses Technology to Identify 75 Percent More Potholes
At 340 square miles, the City of Memphis is among the largest in the United States in terms of land area. Memphis has over 6,800 lane-miles of city streets, enough to drive back and forth to Los Angeles four times. Keeping these streets well maintained and safe for citizens and visitors is
