





Wayfair Writes its Success Story with BigQuery for Internal Analytics

4944
Of your peers have already read this article.
4:00 Minutes
The most insightful time you'll spend today!
Editor’s note: Home-goods and furniture giant Wayfair first partnered up with Google Cloud to transform and scale its storefront—work that proved its value many times over during the unprecedented surge in ecommerce traffic during 2020. Today, we hear how BigQuery’s performance and cost optimization have transformed the company’s internal analytics to create an environment of “yes”.
At Wayfair, we have several unique challenges relating to the scale of our product catalog, our global delivery network, and our position in a multi-sided marketplace that supports both our customers and suppliers. To give you a sense of our scale we have a team of more than 3,000 engineers with tens of millions of customers. We supply more than 20 Million items using more than 16,000 supplier partners.
Serving those constituents generates a lot of analytics work. Wayfair runs over a billion ‘analytic’ database queries a year, from both humans and systems, against multi-petabyte datasets. Scaling our previous environment to meet these challenges required us to maintain dozens of copies of data for different use cases and manage complex data synchronization routines to move trillions of records each day, resulting in long development times and high support costs for our analytics projects.
Centralizing our data using Cloud Storage and BigQuery enabled us to break down existing silos and build unified pipelines for our batch and real-time operations. BigQuery shines by letting us decouple our compute and storage resources and flexibly ingest structured data in streaming and batch modes. We also benefit from the same decoupling for more complicated machine learning (ML) workflows in Dataproc and Cloud Storage. In particular, BigQuery is extremely low maintenance. From ML and easy data integrations to the integrated query cache, many out-of-the-box features have proven valuable for multiple use cases.
Beyond storage and compute, Google Cloud offers multiple tools to maximize the value of our data. For example, we can easily connect Data Studio to BigQuery for lightning-fast dashboarding of enterprise KPI reporting. When we need to dive deeper into a metric, Looker provides an interface and semantic model that empowers more business users to answer important questions — without understanding SQL or our vast dataset and table structure.
The combination of all of Google Cloud’s tools enables every Wayfairian the opportunity to self-serve their data visualization and analysis needs. We are able to support all of the requirements of our internal and external users, from descriptive analytics to alerting and ML, in a platform that blends Google’s proprietary technology with open-source standards.we have seen a greater than 90% reduction in the number of analytic queries in production that take more than one minute to run
As a result, we have seen a greater than 90% reduction in the number of analytic queries in production that take more than one minute to run, which delights our users and increases adoption of our analytics tools across the business.
Higher performance means saying “Yes” more often
We went into the BigQuery experience expecting very strong performance on large, aggregate queries and excellent scalability — the kind of performance that could enable consistent 5-15 minute processing queries and 5-10 second response times for large analytics queries.
We weren’t disappointed — we saw slightly better than linear performance profiles as record counts went up from millions to trillions for a flat resource allocation. BigQuery had the expected high performance for aggregate queries. This made our large data processing pipelines predictable and straightforward to maintain and optimize.
Below is a plot of gigabytes processed by a query against query run time in seconds; outliers are filtered and the axes are pruned to ranges where we had a large sample size. This focuses on longer-duration queries. As an example of the linear performance, a 2 terabyte query averages 5 minutes — 2.5min/terabyte — and an 18 terabyte query (9 times as much data) averages 25s — only 1.4min/terabyte. This is despite the fact that complex queries [sorting and analytic functions are particularly problematic] are more common with large data sizes. We do see increasing variability at large sizes as slot limits and other resource constraints come into play, but these factors are controllable and ultimately a business optimization decision.
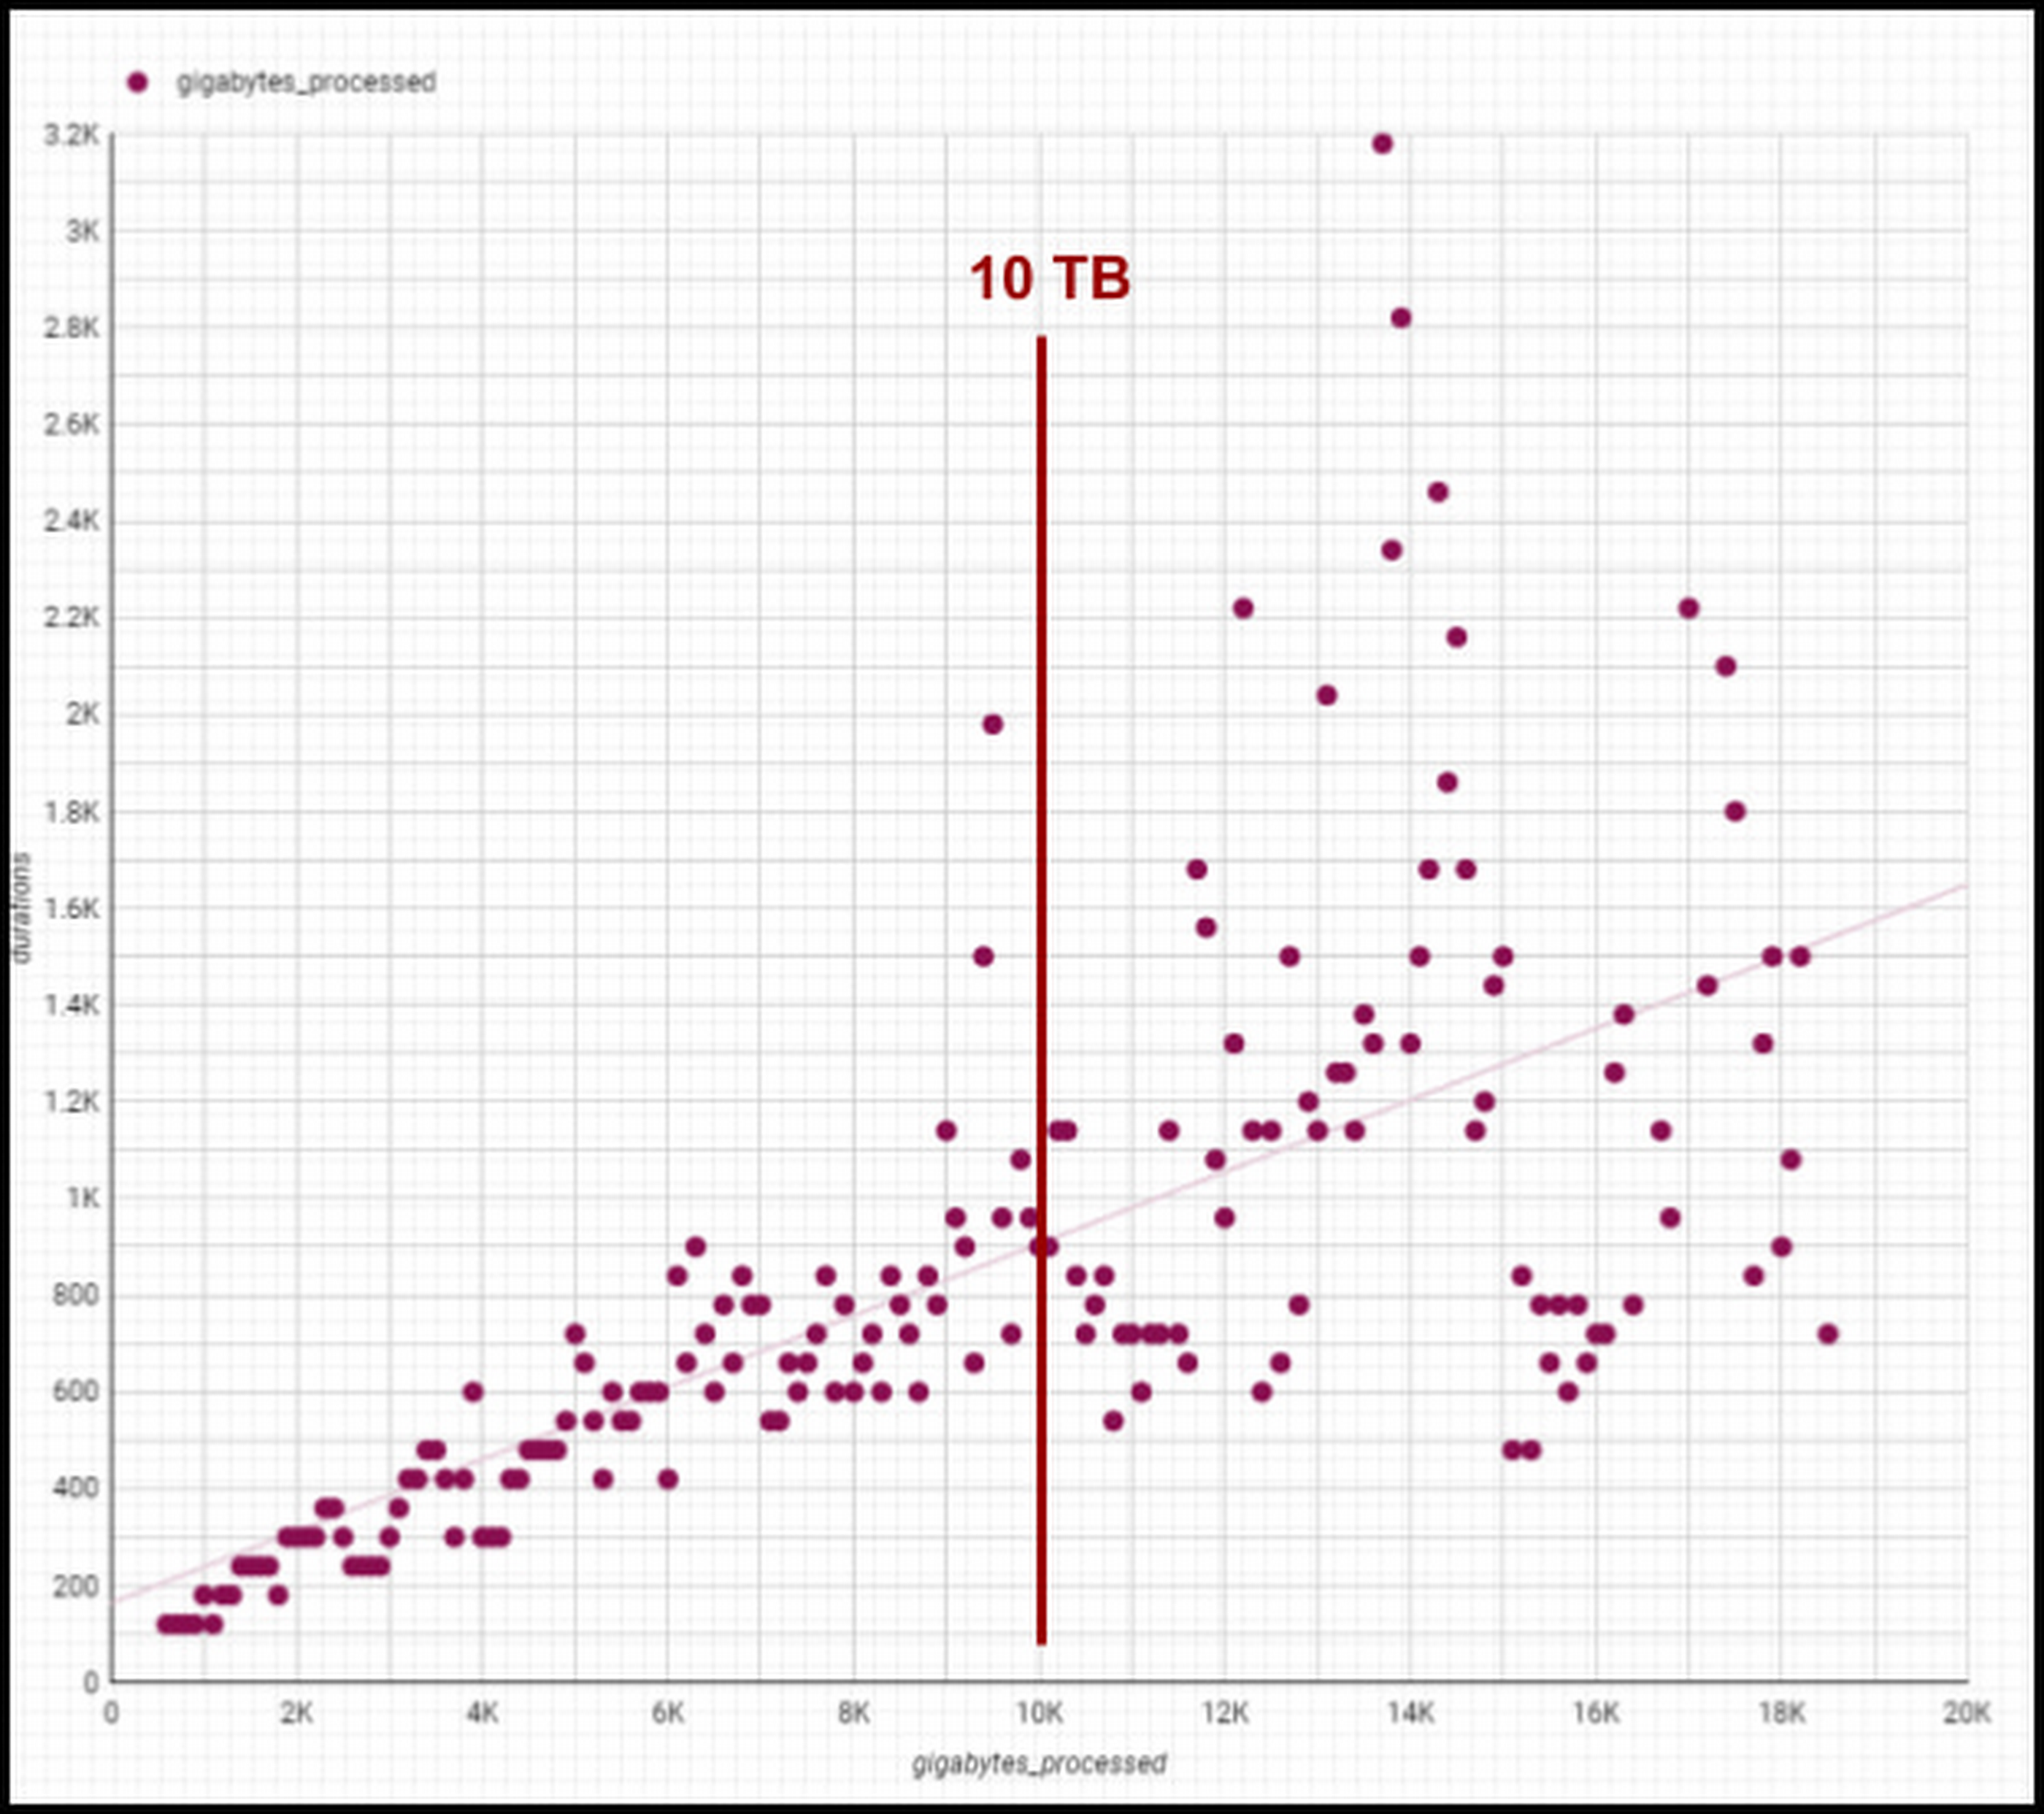
Though individual values vary greatly depending on query complexity [analytic functions/sorting can be computationally expensive], the overall trend line is below 1-1 for bytes versus duration, meaning our BigQuery query runtimes are increasing slower than our data volumes. We are still seeing sub 1:1 threshold runtimes, and we’re already at 100 PB of total data with single queries running on 50PB or more. Going strong!
One unexpected and pleasant surprise has been high performance for smaller queries, such as those required for development, interactive analytics, and internal applications we use for forecasting, segmentation, and other latency-sensitive data workflows. BigQuery’s resource management systems have provided smoother degradation and parallelism profiles than we initially expected for a multi-tenant platform.
We regularly see sub-second p50 query performance for interactive use cases, with p90 performance coming in under 10 seconds for Looker, Data Studio, and AtScale — meeting the threshold we set to avoid analysts losing focus during a business investigation. The chart below shows p50, p90, and p95 timing for core workloads, as well as the number of queries in each bucket and the number of unique users. [Looker and Atscale will use small numbers of service accounts for a large number of users].

This has enabled two important shifts in the way our customers experience analytics services:
- Delivering better user productivity. People no longer have long wait times to get results for a basic query delivering an improved overall user experience.
- Scaling our data transformation. BigQuery has proven, effective data transformation that allows us to embrace the industry shift away towards ELT (extract, load, transform) to transform raw data right within the database.
We no longer have to ask ourselves, “Can we meet the SLA for this data processing task?” The new conversation is, “Of course, we can meet it. What’s the associated cost based on how many resources we assign?” We can make cost and resource trade-offs clear to our users and say “yes” more often to requirements that have measurable business value.
Supporting cost vs. performance decisions
Democratized access to internal analytics is a powerful decision-making tool. With BigQuery’s robust tooling, the decision about how to best allocate computational resources is in the hands of the analytics groups closest to the business decision being made. If they want to spend a sprint optimizing a dashboard, they can show exactly how much money it will save. If they choose not to optimize a report, they can offset the decision with concrete cost savings and other realized value.
Wayfair teams also benefit from visibility into their committed costs by abstracting away the details of the underlying services, including BigQuery slots, the virtual CPUs used to execute SQL queries.
Take a look at this example view consumed by our teams (the metrics for these dashboards are from the BigQuery INFORMATION_SCHEMA (jobs and reservations tables):
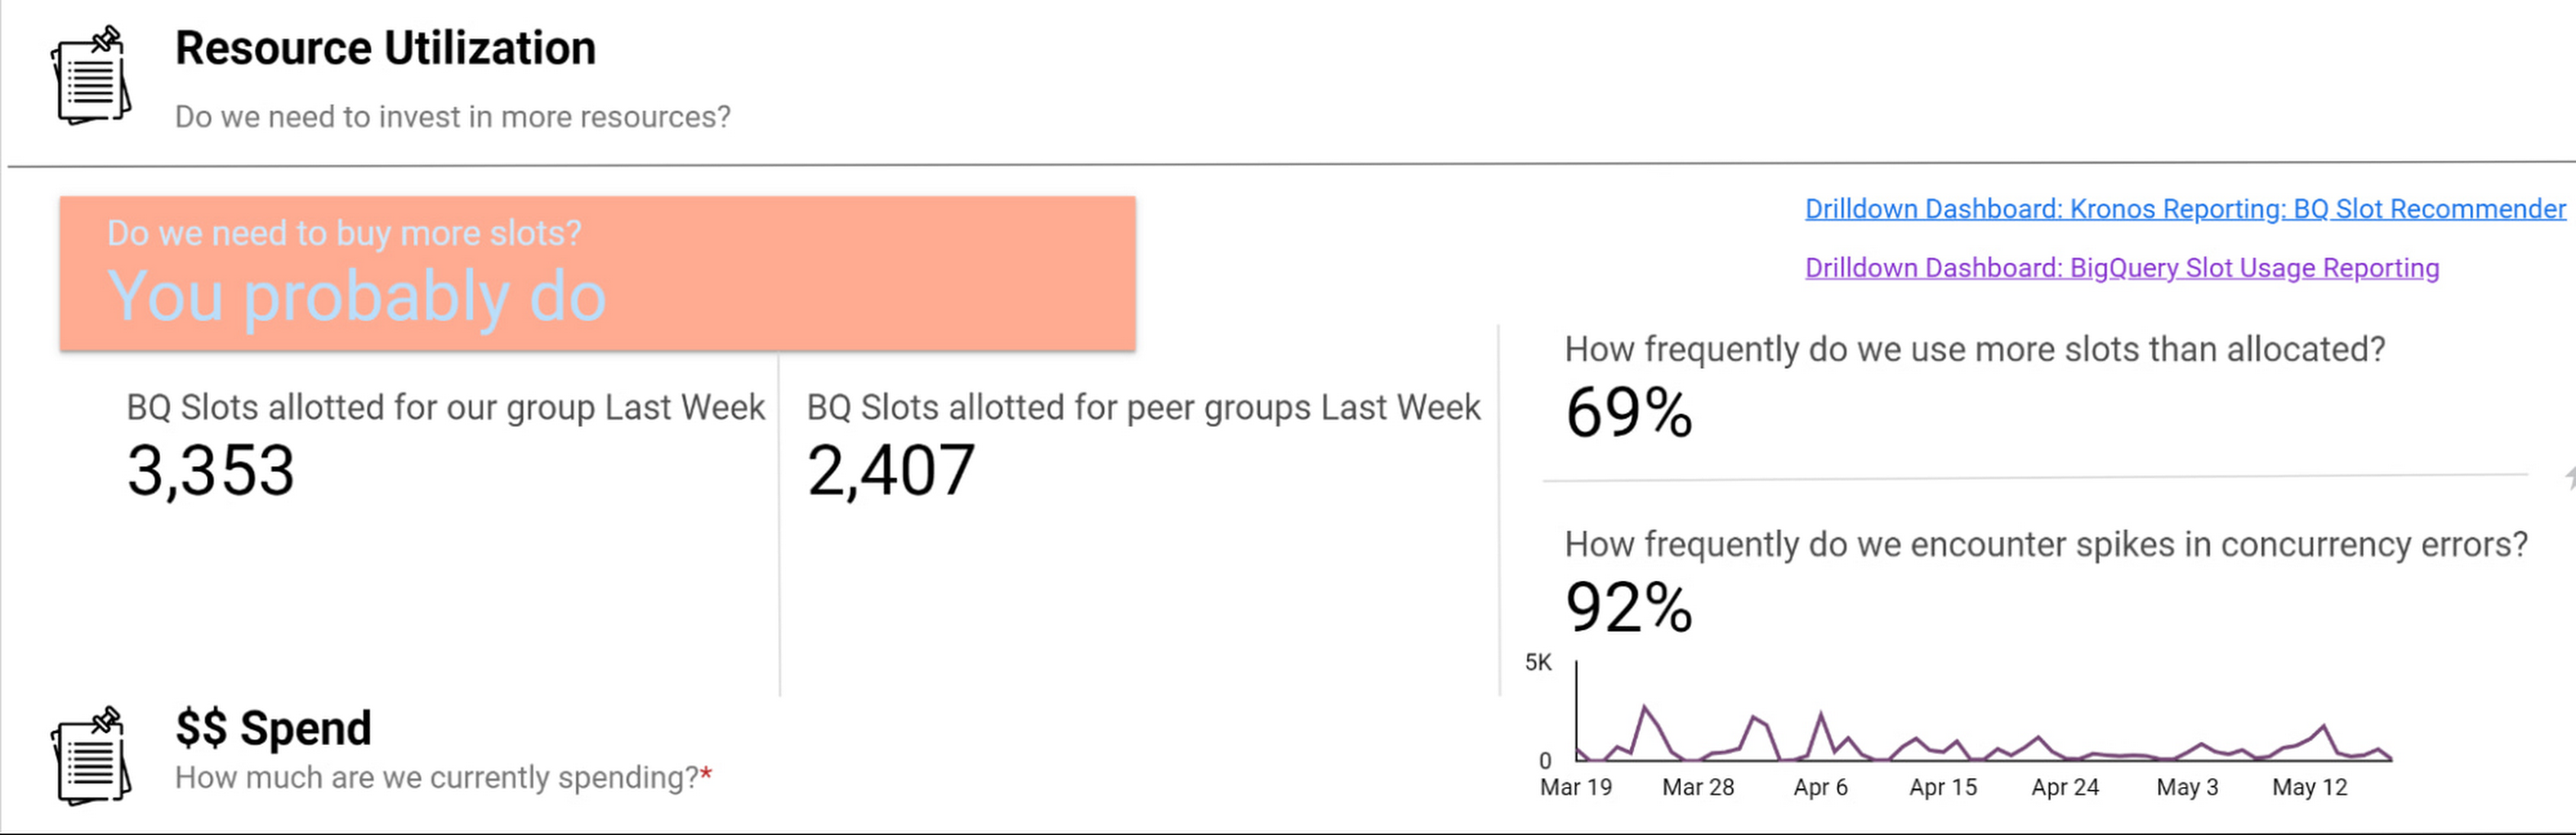
Suppose an organization wants to purchase capacity for a period of time. In that case, we provide an average cost for a slot during that time and charge them based on their slot usage for queries, multiplied by the average price.
Teams can see whether their consumption matches their reservations with a consistent, high-level number. We apply the same approach to tools like Dataproc by aggregating up the costs of component services and providing an organizational cost for those services.
How we use performance signals to improve user efficiency
Instead of overcorrecting for occasional performance fluctuations by allocating excessive resources, we try to align incentives so that people make the right choices for the business. Showback doesn’t work in a vacuum — it requires context and integrated insights. Teams need to show the cost of running a dashboard as well as the ROI is in terms of end user engagement and what peer dashboards with equivalent source datasets might cost.
We want to give users the freedom to do things the way they want and need to while also educating them on achieving their goals and using best practices to reduce their costs and improve their performance. The goal is never for all dashboards to load “less than x seconds” — we believe that any dashboard can load in x seconds when it is properly designed and resourced.
For instance, BigQuery allocates slots for a new workload quickly and efficiently, and queries that are optimized and have dedicated resources consistently complete quickly. When users experience a slowdown, it’s typically because they are sharing resources or inefficiently using their resources. Variable performance is a useful signal to help users discover opportunities to optimize queries and work more productively. We value these signals as we like to focus on the aggregate experience of all users interacting with the tool, not individual interaction.
A natural way to improve user efficiency is to reward ideal behaviors and discourage those that do not align with our analytics strategy. Some examples include splitting out high-demand reporting from ad-hoc exploration to reduce concurrency errors or encouraging people to use materialized tables instead of writing complex custom SQL. For instance, a dedicated reporting project might only include an organization’s Data Studio dashboard if it directly references a table or meets other optimization requirements. Using this approach, we give our users a high degree of freedom and experimentation at the entry-level while providing a well-documented path to scale.
Visibility into query performance improves business performance
The detailed tracking information we get from Google Cloud products is critical — Google’s robust analytics performance has enabled us to scale Data Studio to over 15,000 Wayfarians. Of course, a larger user base always comes with concerns that less sophisticated users may not appropriately optimize their queries or make the best use of the infrastructure.
Evaluating the different Data Studio dashboards helps us identify opportunities to use better query optimization practices, such as reducing custom queries, connecting directly to permanent tables, or using the BI Engine to improve dashboard performance. Recently, our team built new billing projects specific for Data Studio reporting. We can scale up a reservation dedicated to reporting about a major sales event in minutes.
Beyond everyday reporting, holidays and sales events may require higher, guaranteed performance. BigQuery’s flexible capacity commitments allow us to decide at a business level whether an urgent need requires us to reprioritize resources immediately or whether we have the time to optimize queries and rebuild dashboards to be performant. These new billing projects let us evaluate if teams need to scale up resourcing, what areas they can optimize in BigQuery, or if a new reservation is needed to resource that team separately.
Recommendations for achieving high performance at low cost
Are you wondering how to allocate BigQuery slots? Teams must see direct, immediate return on their investment in performance and optimization.
Our first rule of thumb is to align resource utilization with ownership as closely as possible. This makes it easier for teams to secure dedicated resources, even if they start out small. We’re comfortable doing this because BigQuery dynamically reassigns capacity between the targeted reservation and other consumers in milliseconds. We always get the total usage of our slots — there is no wasted capacity even when we break assignments down granularly.
Once a team has a reservation, we provide reporting that consumes various BigQuery information schema views, such as query logs and reservation information, and processes it into aggregated reporting. We look for metrics like the average slots available to a query at a point in time, overall query performance, and how long queries took to execute to pinpoint the overall health of a reservation against our business objectives. Flex slots also let us experiment easily with additional capacity, and BigQuery’s performance is so consistent that we can use straightforward models to estimate return on additional slot investment.
Other key cost optimization tips we have found helpful at Wayfair include:
- Optimize for worst-case performance. Given BigQuery’s ability to share slots, we expect teams will often see much better performance, but we find that thinking it’s more effective when teams think about the most pessimistic case when resourcing their jobs.
- Take advantage of BI Engine reservations. We like to think critically about the data and workload. BI Engine reservations are excellent for workloads that query lots of small dimension tables or a few larger tables loaded into memory. In cases like that, such as with OLAP tools using pre-computed aggregates, we’ve seen BI engine investments drive a 25% reduction in average query time—excellent ROI.
- Leverage Looker for large, longitudinal datasets. Since Looker supports a wide range of use cases, we see a broader range of performance — p50 is still under a second, but p95 can get as high as a minute. For these cases, we recommend modeling user patterns [first of month, first day of week] and dynamically allocating more slots for these periods while deprioritizing batch workloads in the key windows.
- Lean in heavily on the BQ cache for broad-based reporting. To avoid a Monday morning reporting lag, We use the BigQuery cache to avoid Monday morning report loading lags. Up to 30% of our Data Studio queries hit the BQ cache, ensuring our Data Studio p95 consistently stays under 10 seconds.
- Use slots-per-job to improve experience. In our reporting, we find that the most valuable view is slots-per-job. We look for dips in slots available for jobs as this situation often correlates strongly with poor user experiences. For example, our reporting showed us that Looker has the highest volumes of queries and users on Mondays and during each month’s first two business days. We used this information to scale up slots to support these periods of highest demand, delivering on performance SLAs to support business users.

- Get a global picture of usage. We manage slots in a central tool. Teams input their requirements into a calendar to indicate when they want higher or lower capacity to inform our flex slot purchases and annual commitments. It might seem like dozens of relatively inconsistent workloads at the team level, but the picture changes when you look at demand across a week (or our entire business). Understanding global usage makes it easy for us to model baseline capacity recommendations for serving year slots versus flexible demands.
Reaping the rewards of BigQuery
From our first initial undertaking with Google Cloud to transform our storefront, we had a lot of confidence in the underlying technology offerings and the teams that ran them and their ability to meet our unique requirements. But our experience using BigQuery for internal analytics at Wayfair has exceeded our already high expectations.
BigQuery’s fast, dynamic allocation of resources and ability to transform data in place are important to our mission of maintaining consistently high performance for our users while closely managing costs. Moreover, our visibility into query and dashboard performance through BigQuery’s DSP views and other performance metrics have helped us make clearer connections between performance goals and the costs required to meet them — and guide our analysts across the company towards attaining high performance on every project.
Seven-Eleven Japan Leverages Google Cloud’s Performance and Speed for Real-time Business Insights

6847
Of your peers have already read this article.
4:00 Minutes
The most insightful time you'll spend today!
With the rise of technologies like smartphones, retailers have felt the pressure to meet evolving consumer needs and expectations. Seven-Eleven Japan(“SEJ”) has long been on the forefront of this thanks to the way they develop and invest in IT. However, in recent years, Japan’s leading convenience store chain has struggled to maintain its complex legacy systems at the rate needed to keep up with today’s rapid digitization, spurred on by the increasing proliferation of smartphones and an IT vendor-dependent structure.
Legacy systems limiting real-time responsiveness and innovation
Since its early days, SEJ has been proactive in adopting information technology, mainly relying on technology solutions from Japan’s leading vendors. But as the systems have grown, key business issues have been resolved using a vendor-dependent structure rather than being driven by SEJ’s own needs.
Datasets and business logic were combined and built into legacy environments, gradually leading to data silos. As a result, data was distributed across multiple systems, causing a variety of problems, including the inability to efficiently retrieve data when needed, delays in accessing data collected in individual stores, and difficulties taking measurements at the right time in business operations that require real-time responsiveness.
Connecting different systems also takes time and money, and the lead time for introducing new services—from planning to development and launch—has been longer than expected.
To solve these problems, SEJ’s IT department built “Seven Central”—a new platform for practical data use launched in 2020 to support the company’s future IT strategies and digital transformation initiatives.
At its core, Seven Central’s ultimate purpose is to allow real-time data views. Versatile, real-time datasets—such as point-of-sale (POS) data from 7-Eleven stores—are consolidated into a centralized location in the cloud. They created a simple data mart that provides data via an API to enable them to respond more quickly to requests from individual departments.
“In such uncertain times, it’s vital to use data to make quick decisions,” says Izuru Nishimura, Executive Officer and Head of ICT Department. “Each department across the entire company will be able to gain an immediate understanding of the situation based on the most up-to-date data and respond accordingly. This is why we built Seven Central.”
Google Cloud selected to help SEJ build and grow their data cloud
Today’s rapidly changing business environment has also highlighted the risk of IT support becoming a bottleneck. The long-term strategy is to gradually expand the datasets managed and collected in Seven Central according to business needs.
In the first phase, SEJ collected POS data from all 21,000+ stores to enable real-time analysis. Moving forward, they would like to collect other relevant data—for example, unstructured data, such as images and videos, or master datasets that are currently stored externally.
Google Cloud was already a top contender when SEJ started developing Seven Central in 2019. They compared various public cloud services besides Google Cloud, focusing on three main capabilities.
“We placed particular emphasis on service scalability to drive future digital transformation; security when handling data, which is the lifeline of our company; and finally, openness,” says Nishimura. He emphasizes that openness was perhaps the most important factor for choosing Google Cloud. Breaking away from the negative aspects of an entirely vendor-dependent system enabled them to build an agile development system with multiple vendors.
Google Cloud technologies including BigQuery and API management platform, Apigee, play a vital role in Seven Central. BigQuery’s high-speed processing at petabyte scale and fully managed infrastructure helped keep costs low during development and verification.
“Data is stored in a way that allows you to share it easily across organizations, which helps solve the issue of data silos from the perspective of scalability. I also like the fact there are some interesting features that could be used in the future—like BigQuery ML, which enables machine learning on BigQuery,” says Nishimura.
Apigee allows SEJ to separate datasets and business logic, which is one of the key points of Seven Central. While the trend these days is to standardize interfaces using an API, the reality tends to involve many different APIs rather than the introduction of one unified API. With Apigee, SEJ provides a single unified API for all of its data cloud, and they can now understand what data is used thanks to Apigee’s API usage visualizations.
“Right now, we collect data from all 21,000+ stores,” says Nishimura. “But in anticipation of a future expansion in business operations, we have designed a system that can scale up and run without issue, even if we were to have 30,000 stores, with 1,000 customers per store per day, purchasing five items per person.”
Real-time insights with BigQuery and Cloud Spanner
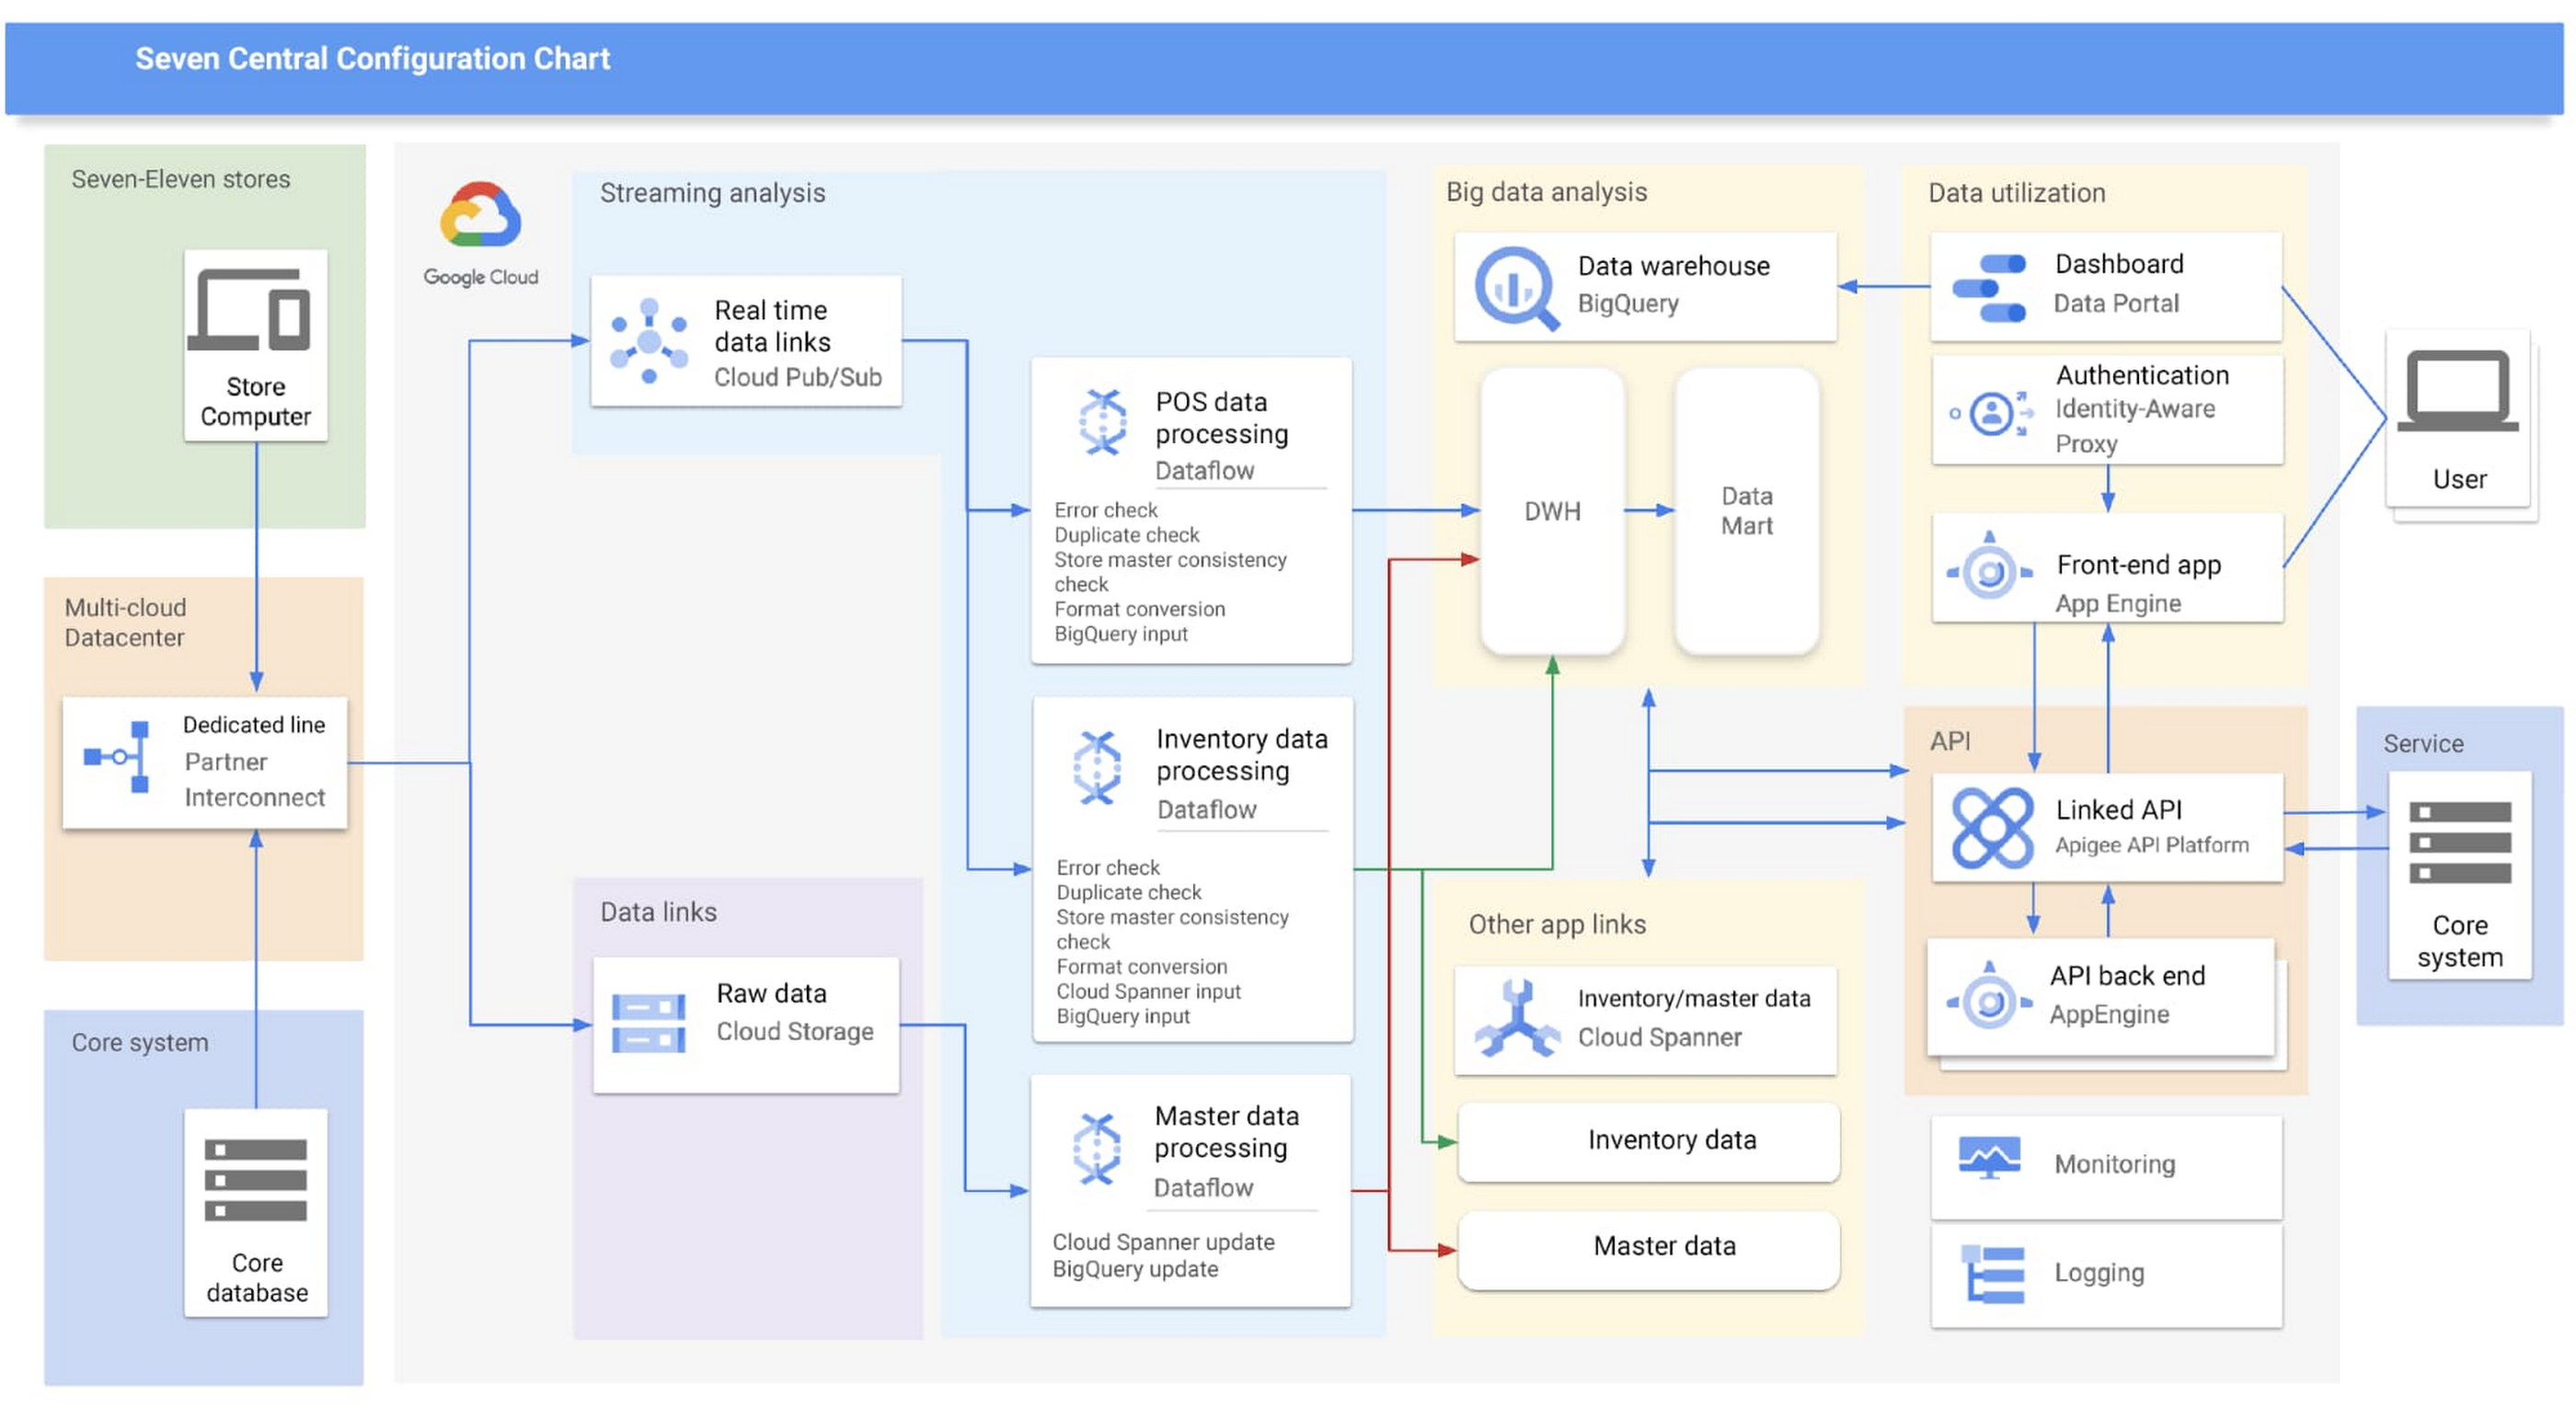
Google Cloud partner Cloud Ace came on board early in the planning phases. Based on their recommendations, SEJ decided to continue making full use of BigQuery to analyze data collected from all 21,000+ stores throughout Japan, while also using Cloud Spanner’s availability, near-unlimited scalability and transactional consistency to help achieve the real-time results needed for the project.
“Given that both the data and the regularity with which it is accessed are expected to steadily increase in the future, we chose Cloud Spanner as backend storage for data delivery via API. We consider it a good choice,” says Shota Kikuchi, General Manager, Consulting Department, Technology Division, Cloud Ace Co., Ltd.
Finally, they chose to use Google Cloud’s Stream Analytics Solutions messaging service for collecting POS data in real time, which can then be put to immediate use with Cloud Spanner and BigQuery.
High-speed responses exceed targets and create new value
Seven Central went live in September 2020 with surprising results.
They initially set a target time of one hour from when a customer makes a purchase to the point when Seven Central can use that data. But when the final system was first tried—it took barely a minute. Moving forward they estimate that the latest inventory data from the service side will become available within a few minutes of being added to the system.
“This is real innovation, and I must admit that I am quite surprised. As well as being able to solve existing issues, we also hope it will lead to new improvements and services that have been unimaginable up until now,” says Nishimura.
The team hopes to roll out the Seven Central platform in all companies affiliated with Seven & i Holdings—not just SEJ. They also plan to explore Google Cloud AI and machine learning technologies to take on challenges in new areas. For example, they are investigating the idea of clustering individual stores using BigQuery ML.
Seven Central has already attracted attention from many departments and received a lot of requests. Nishimura and his team say they hope to continue to grow Seven Central while still observing their fundamental principles—not including business logic, maintaining real-time results, and staying true to the uniqueness of SEJ.
Learn more about Google Cloud smart analytics solutions.
A Look Back on Google Cloud’s Data Analytics Development Efforts from June

5981
Of your peers have already read this article.
4:00 Minutes
The most insightful time you'll spend today!
June is the month that holds the summer solstice, and some of us in the northern hemisphere get to enjoy the longest days of sunshine out of the entire year. We used all the hours we could in June to deliver a flurry of new features across BigQuery, Dataflow, Data Fusion, and more. Let’s take a look!
Simple, Sophisticated, and Secure
Usability is a key tenant of our data analytics development efforts. Our new user-friendly BigQuery improvements this month include:
- Flexible data type casting
- Formatting to change column descriptions
- GRANT/REVOKE access control commands using SQL
We hope this will delight data analysts, data scientists, DBAs, and SQL-enthusiasts who can find out more details in our blog here.
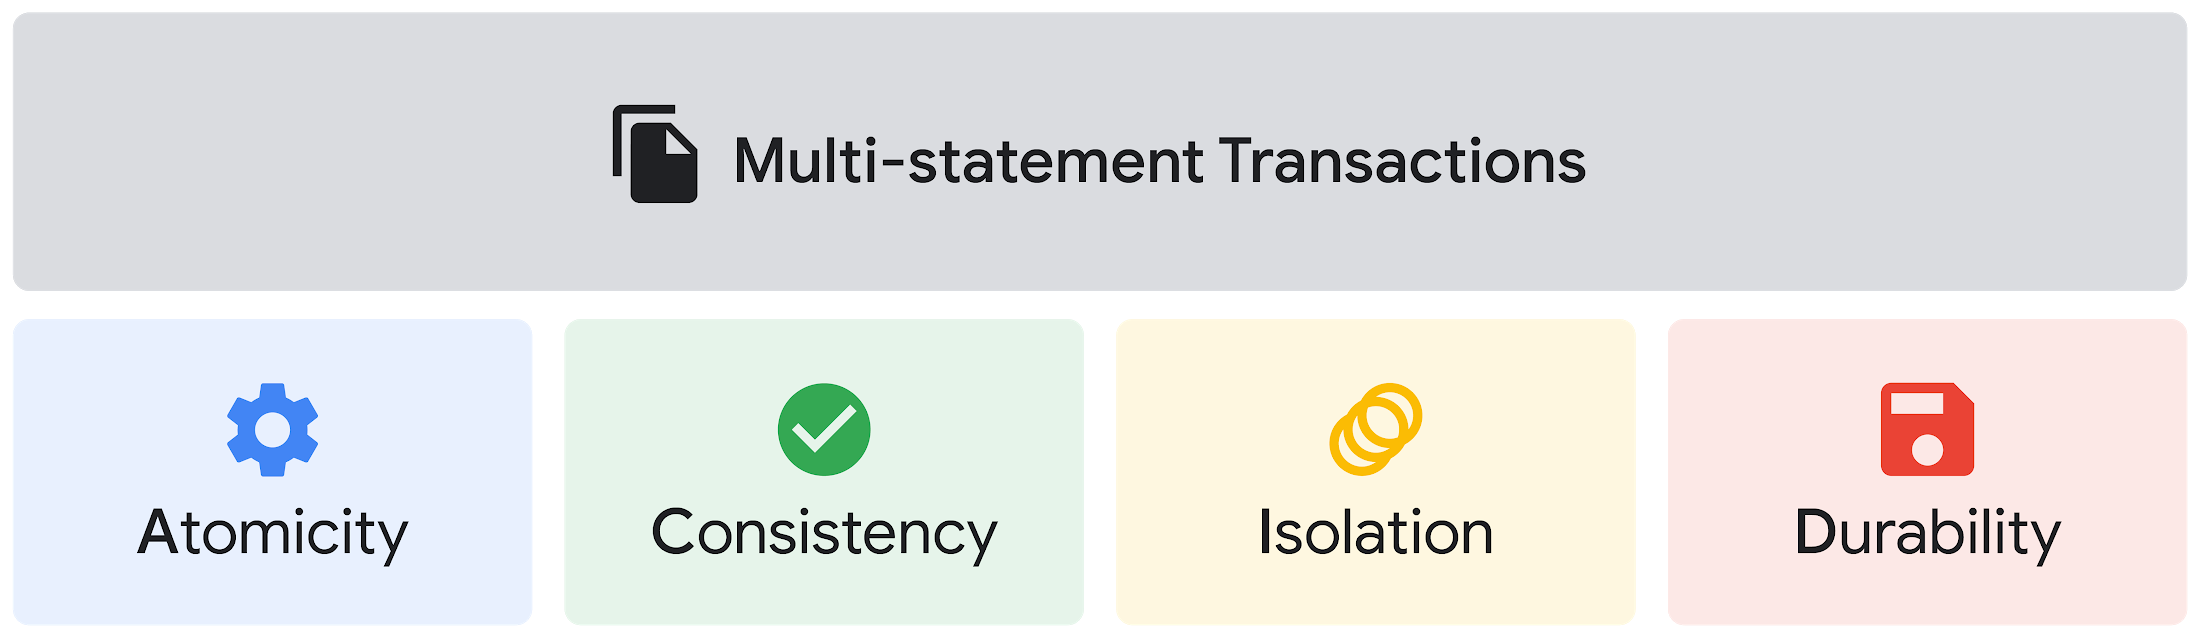
Beyond simplifying commands, we also recognize that it’s equally important to have more sophistication when dealing with transactions. That’s why we introduced multi-statement transactions in BigQuery.
As you probably know, BigQuery has long supported single-statement transactions through DML statements, such as INSERT, UPDATE, DELETE, MERGE and TRUNCATE, applied to one table per transaction. With multi-statement transactions, you can now use multiple SQL statements, including DML, spanning multiple tables in a single transaction.
This means that any data changes across multiple tables associated with all statements in a given transaction are committed atomically (all at once) if successful—or all rolled back atomically in the event of a failure.
We also know that organizations need to control access to data, down to the granular level and that, with the complexity of data platforms increasing day by day, it’s become even more critical to identify and monitor who has access to sensitive data.
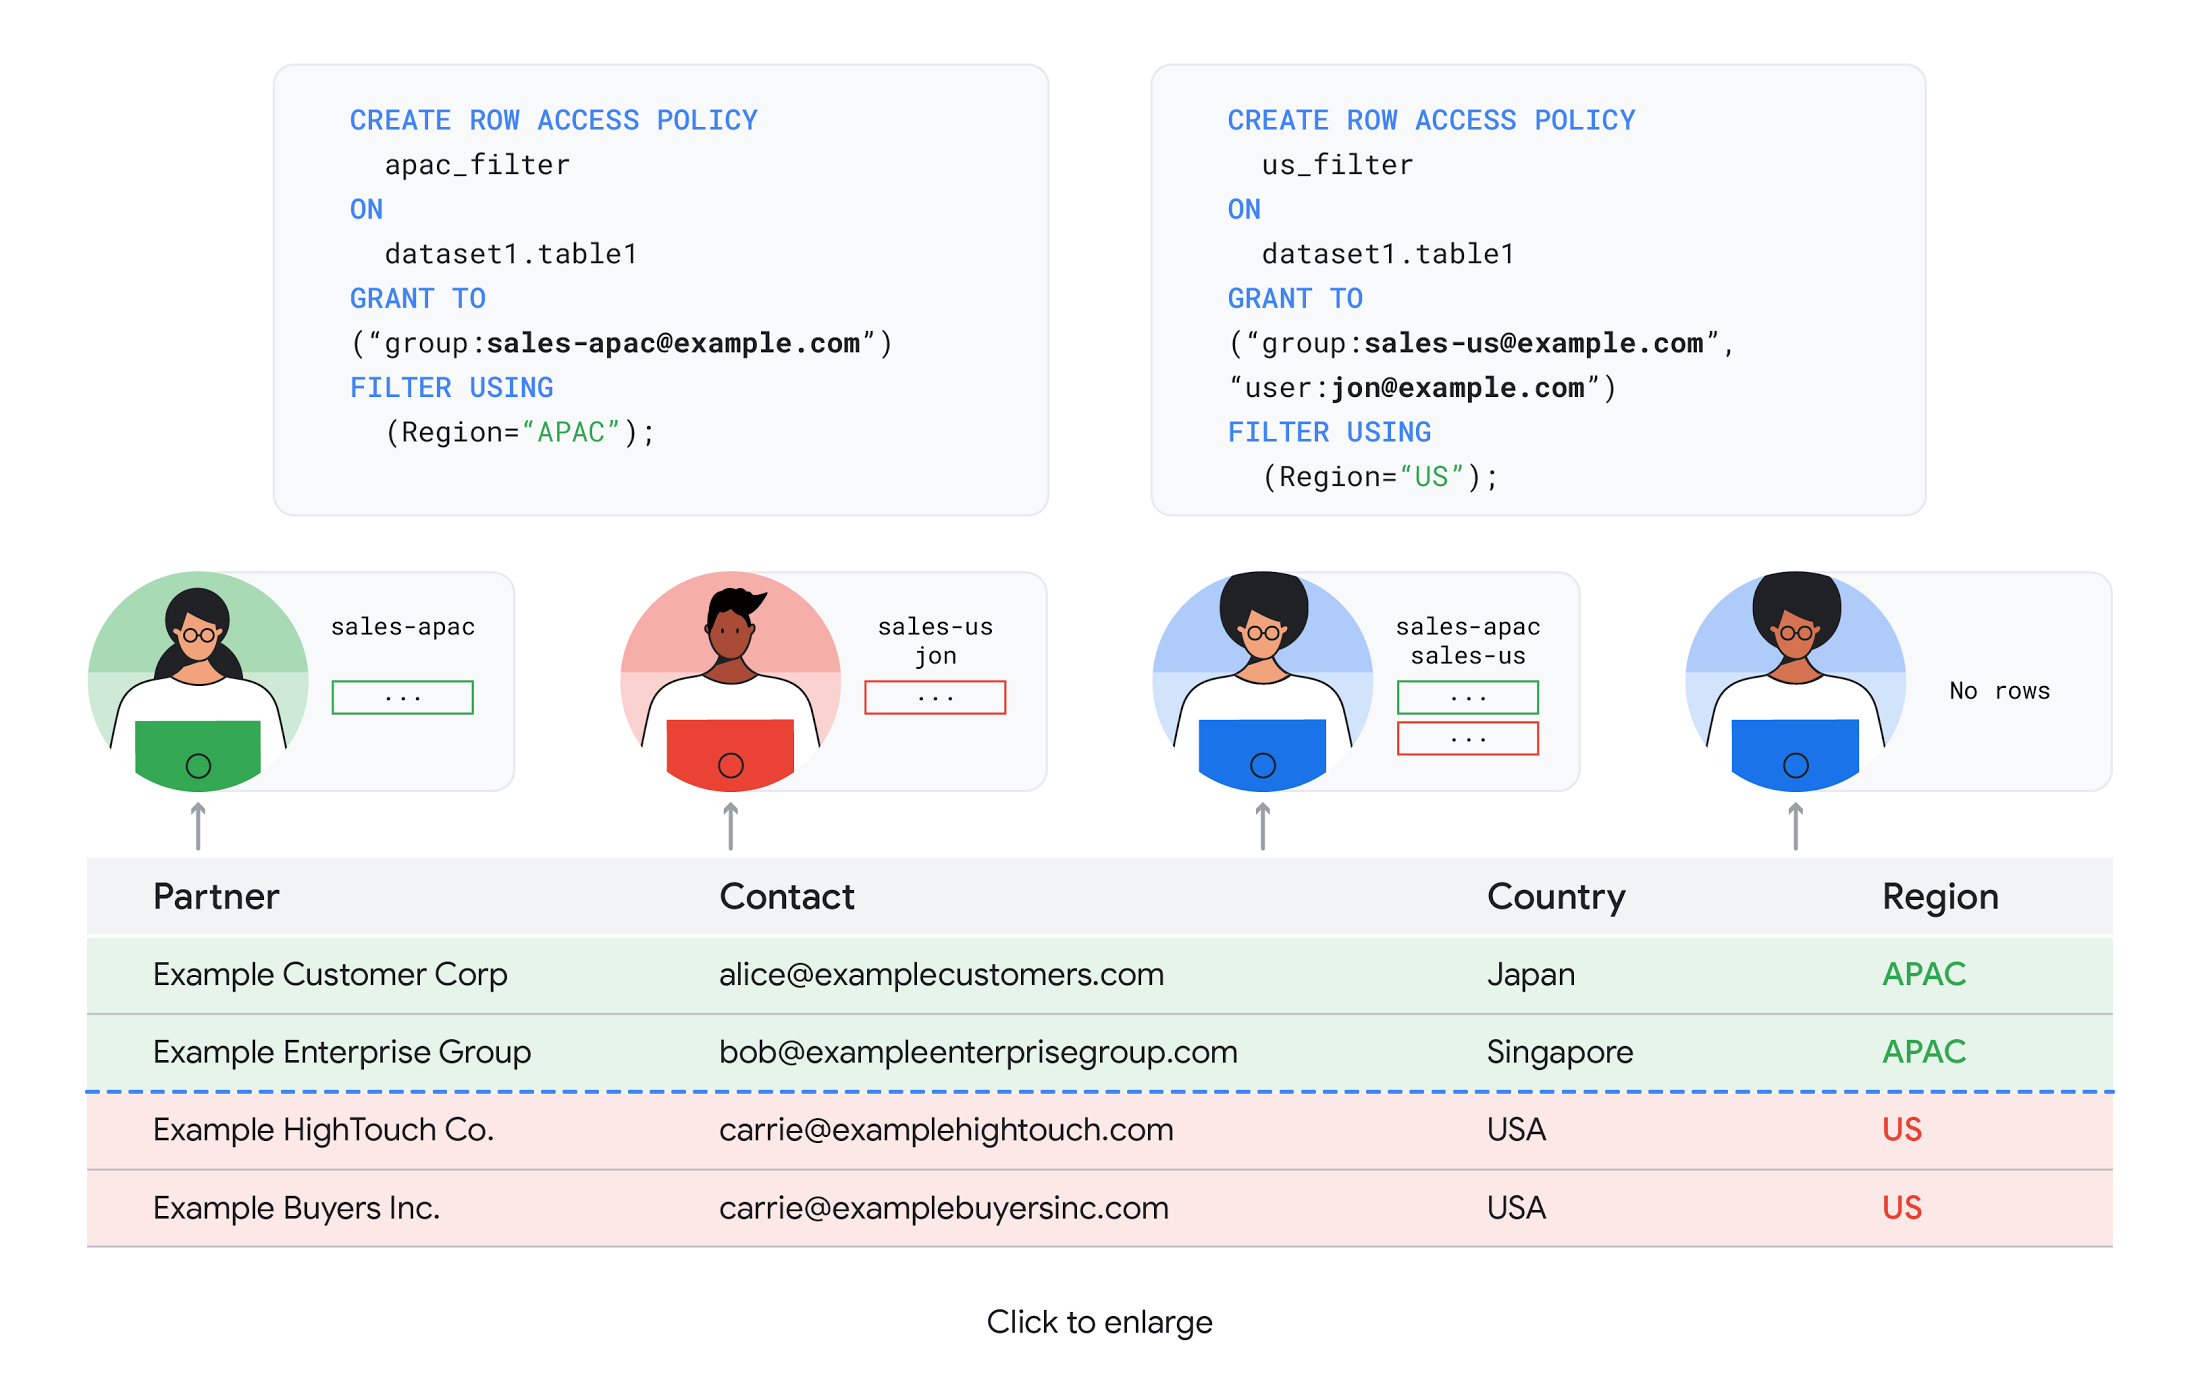
To help address these needs, we announced the general availability of BigQuery row-level security. This capability gives customers a way to control access to subsets of data in the same table for different groups of users. Row-level security in BigQuery enables different user personas access to subsets of data in the same table and can easily be created, updated, and dropped using DDL statements. To learn more, check out the documentation and best practices.
Simple, Safe, and Smart
Beyond building a simpler, more sophisticated and more secure data platform for customers, our team has been focused on providing solutions powered by built-in intelligence. One of our core beliefs is that for machine learning to be adopted and useful at scale, it must be easy to use and deploy.
BigQuery ML, our embedded machine learning capabilities, have been adopted by 80% of our top customers around the globe and it has become a cornerstone of their data to value journey.
As part of our efforts, we announced the general availability of AutoML tables in BigQuery ML. This no-code solution lets customers automatically build and deploy state-of-the-art machine learning models on structured data. With easy integration with Vertex AI, AutoML in BQML makes it simple to achieve machine learning magic in the background. From preprocessing data to feature engineering and model tuning all the way to cross validation, AutoML will “automagically” select and ensemble models so everyone—even non-data scientists—can use it.
Want to take this feature for a test drive? Try it today on BigQuery’s NYC Taxi public dataset following the instructions in this blog!
Speaking of public datasets, we also introduced the availability of Google Trends data in BigQuery to enable customers to measure interest in a topic or search term across Google Search. This new dataset will soon be available in Analytics Hub and will be anonymized, indexed, normalized, and aggregated prior to publication.
Want to ensure your end-cap displays are relevant to your local audience? You can take signals from what people are looking for in your market area to inform what items to place. Want to understand what new features could be incorporated into an existing product based on what people are searching for? Terms that appear in these datasets could be an indicator of what you should be paying attention to.
All this data and technology can be put to use to deploy critical solutions to grow and protect your business. For example, it can be difficult to know how to define anomalies during detection. If you have labeled data with known anomalies, then you can choose from a variety of supervised machine learning model types that are already supported in BigQuery ML.
But what if you don’t know what kind of anomaly to expect, and you don’t have labeled data? Unlike typical predictive techniques that leverage supervised learning, organizations may need to be able to detect anomalies in the absence of labeled data.
That’s why, we were particularly excited to announce the public preview of new anomaly detection capabilities in BigQuery ML that leverage unsupervised machine learning to help you detect anomalies without needing labeled data.
Our team has been working with a large number of enterprises who leverage machine learning for better anomaly detection. In financial services for example, customers have used our technology to detect machine-learned anomalies in real-time foreign exchange data.
To make it easier for you to take advantage of their best practices, we teamed up with Kasna to develop sample code, architecture guidance, and a data synthesizer that generates data so you can test these innovations right away.
Simple, Scalable, and Speedy
Capturing, processing and analyzing data in motion has become an important component of our customer architecture choices. Along with batch processing, many of you need the flexibility to stream records into BigQuery so they can become available for query as they are written.
Our new BigQuery Storage Write API combines the functionality of streaming ingestion and batch loading into a single API. You can use it to stream records into BigQuery or even batch process an arbitrarily large number of records and commit them in a single atomic operation.
Flexible systems that can do batch and real-time in the same environment is in our DNA: Dataflow, our serverless, data processing service for streaming and batch data was built with flexibility in mind.
This principle applies not just to what Dataflow does but also how you can leverage it—whether you prefer using Dataflow SQL right from the BigQuery web UI, Vertex AI notebooks from the Dataflow interface, or the vast collection of pre-built templates to develop streaming pipelines.
Dataflow has been in the news quite a bit recently. You might have noted the recent introduction of Dataflow Prime, a new no-ops, auto-tuning functionality that optimizes resource utilization and further simplifies big data processing. You might have also read that Google Dataflow is a Leader in The 2021 Forrester Wave™: Streaming Analytics, giving Dataflow a score of 5 out of 5 across 12 different criteria.
We couldn’t be more excited about the support the community has provided to this platform. The scalability of Dataflow is unparalleled and as you set your company up for more scale, more speed, and “streaming that screams”, we suggest you take a look at what leaders at Sky, RVU or Palo Alto Networks have already accomplished.
If you’re new to Dataflow, you’re in for a treat: this past month, Priyanka Vergadia (AKA CloudGirl) released a great set of resources to get you started. Read her blog here and watch her introduction video below!
https://youtube.com/watch?v=WRspZRG9e90%3Fenablejsapi%3D1%26
Simple structure that sticks together
We thrive to be the partner of choice for your transformation journey, regardless where your data comes from and how you choose to unify your data stack.
Our partners at Tata Consultancy Services (TCS) recently released research that highlights the importance of a unifying digital fabric and how data integration services like Google Cloud Data Fusion can enable their clients to achieve this vision.
We also announced SAP Integration with Cloud Data Fusion, Google Cloud’s native data integration platform, to seamlessly move data out of SAP Business Suite, SAP ERP and S4/HANA. To date, we provide more than 50 pipelines in Cloud Data Fusion to rapidly onboard SAP data.
This past month, we introduced our SAP Accelerator for Order to Cash. This accelerator is a sample implementation of the SAP Table Batch Source feature in Cloud Data Fusion and will help you get started with your end-to-end order to cash process and analytics.
It includes sample Cloud Data Fusion pipelines that you can configure to connect to your SAP data source, perform transformations, store data in BigQuery, and set up analytics in Looker. It also comes with LookML dashboards which you can access on Github.
Countless great organizations have chosen to work with Google for their SAP data. In June, we wrote about ATB Financial’s journey and how the company uses data to better serve over 800,000 customers, save over CA$2.24 million in productivity, and realize more than CA$4 million in operating revenue through “D.E.E.P”, a data exposure enablement platform built around BigQuery.
Finally, if you are an application developer looking for a unified platform that brings together data from Firebase Crashlytics, Google Analytics, Cloud Firestore, and third party datasets, we have good news!
This past month, we released a unified analytics platform that combines Firebase, BigQuery, Google Looker and FiveTran to easily integrate disparate data sources, and infuse data into operational workflows for greater product development insights and increased customer experience. This resource comes with sample code, a reference guide and a great blog! We hope you enjoy it. See you all next month!
https://youtube.com/watch?v=L25Vfzr2Ciw%3Fenablejsapi%3D1%26
7486
Of your peers have already watched this video.
1:15 Minutes
The most insightful time you'll spend today!
An Indian Example of How to Really Up Your Customer Experience Game and Increase Conversion Rates With AI
How about selfie analysis of users to recommend them the right lipstick color?
That’s just one of the many ideas folks at Purplle.com came up with to improve the buying experience of Indian consumers.
And without the power of Google Cloud, it would probably have remained just that…an idea.
But today, thanks to Google Cloud, “Nothing seems impossible,” says Suyash Katyayani, CTO, Purplle.
Purplle.com is an online e-commerce company in India and one of the pioneers in creating a digitally-native beauty brands in India.
“The beauty industry is so data intensive that we needed to have a strong data strategy and we were looking out for solutions which would enable us to have a strong data pipeline and a strong data warehousing solution,” says Katyayani.
That’s when it turned to Google Cloud.
Additionally, Purplle.com, says Katyayani, does not have to worry about at what scale the company operates at because they have access to state-of-the-art infrastructure from Google Cloud available to them so that their developers can run experiments.
“The biggest plus point for us has been the agility that Google Cloud has added,” says Katyayani.
ESG Did the Math: It’s Cheaper and Smarter to Migrate Enterprise Data Warehouses to Google BigQuery. Way Smarter
DOWNLOAD WHITEPAPER6487
Of your peers have already downloaded this article
11:30 Minutes
The most insightful time you'll spend today!
Enterprise data warehouses (EDWs) are often deemed the most valuable asset in the data center, serving as the backbone of the business. The ongoing insight gained from these solutions has justified the significant up-front capital investments and ongoing operational costs, but the rigidity of the traditional EDW is forcing organizations to reevaluate their approach to analytics and business intelligence.
While legacy EDW solutions were all about throwing as much computational power as possible at a relatively static data set, with the inflow of new and valuable sources of data and the emergence of all-encompassing analytics initiatives, the success of today’s EDW solutions depends more on operational and resource agility than raw horsepower.
Being able to dynamically adjust to the needs of the business, integrate into operational processes, and quickly react to emerging opportunities can place an organization at a distinct competitive advantage.
Today’s EDW solutions must act as a global repository of information, provide the agility to scale up or down on demand, and seamlessly integrate with other analytics tools and services used throughout a data-driven organization.
Over the last two years, ESG has conducted detailed studies quantifying the economic value of Google data analytics services. The first evaluated Google BigQuery compared to on-premises Hadoop and AWS redshift. The second focused on Google DataProc compared to DIY Spark and Hadoop approaches. Here’s the next iteration of our economic analysis, extending the BigQuery study to incorporate a comparison to legacy enterprise data warehouses, both on-premises and in the cloud.
Through publicly available pricing and in-depth qualitative customer interviews, ESG was able to assert a base set of assumptions that power a dynamic model, incorporating up-front capital investments, deployment and migration costs, expected monthly cloud costs, administrative costs, and operational costs associated with legacy on-premises EDWs, cloud-based EDWs, and Google BigQuery.
The crux of the results show organizations can save up to 52% by using BigQuery over on-premises EDWs and up to 41% over cloud-based EDWs. Unlike legacy on-premises EDWs, BigQuery provides organizations with the key abilities that are essential to delivering a modern EDW solution, most notably the ability to integrate across other Google Cloud Platform services, including its market leading AI-based solutions and services.
Although not called t out directly in the published report, ESG’s models indicate that the savings achieved by migrating an on-premises EDW solution to Google BigQuery may actually be more cost effective than simply continuing to operate an existing on-premises EDW solution.
Google Cloud’s Data Analytics May Recap

6924
Of your peers have already read this article.
5:00 Minutes
The most insightful time you'll spend today!
May was a very busy month for data analytics product innovation. If you didn’t have the chance to attend our inaugural Data Cloud Summit, video replays of all our sessions are now available so feel free to watch them at your own pace.
In this blog, I’d like to share some background behind the innovations we released in May, why we built them the way we did, and the type of value they can bring your company and your team.
But first, a huge thank you!
This week, we had the honor to announce that Google has been named a Leader in The Forrester Wave™: Streaming Analytics, Q2 2021 report. Forrester gave Dataflow a score of 5 out of 5 across 12 different criteria, stating: “Google Cloud Dataflow has strengths in data sequencing, advanced analytics, performance, and high-availability”.
Google has more than a decade of experience in building real-time and internet-scale systems for its own needs, and we are excited to see that our ability to provide customers with a reliable, scalable, and performant platform is bearing fruit.
This announcement comes on the back of the release of The Forrester Wave™: Cloud Data Warehouse, Q1 2021 report, which also named Google Cloud as a Leader.
We couldn’t be more excited about the recognition and appreciate all your feedback and trust in the work that we do to support your goal in accelerating data-powered innovation.
Innovation galore
Your feedback and your passion is the fuel that drives our ambition to deliver more and better services to you. That’s why, this year, we didn’t want to wait until Google Cloud Next to share some great products we have been working on. On May 26, our team announced a slew of new products, services and programs. Watch a quick summary below:
https://youtube.com/watch?v=DG1mOPMXJvw%3Fenablejsapi%3D1%26
Meeting you where you are
An important design principle behind all of our services is “meeting you where you are”. This means we aim to provide you with the tools and software you need to innovate on your own terms. Here are three new services that will help you do just that:
Datastream
Datastream, our new serverless change data capture (CDC) and replication service, allows your company to synchronize data across heterogeneous databases, storage systems, and applications reliably and with minimal latency to support real-time analytics, database replication, and event-driven architectures. Datastream delivers change streams from Oracle and MySQL databases into Google Cloud services such as BigQuery, Cloud SQL, Cloud Storage, and Cloud Spanner, saving time and resources while ensuring your data is accurate and up-to-date.
- Under the hood, Datastream reads CDC events (inserts, updates, and deletes) from source databases, and writes those events with minimal latency to a data destination. It leverages the fact that each database source has its own CDC log—binlog for MySQL and LogMiner for Oracle—which it uses for its own internal replication and consistency purposes.
- Datastream integrates with purpose-built and extensible Dataflow templates to pull the change streams written to Cloud Storage, and create up-to-date replicated tables in BigQuery for analytics. It also leverages Dataflow templates to replicate and synchronize databases into Cloud SQL or Cloud Spanner for database migrations and hybrid cloud configurations.
- Datastream also powers a Google-native Oracle connector in Cloud Data Fusion’s new replication feature for easy ETL/ELT pipelining. By delivering change streams directly into Cloud Storage, customers can leverage Datastream to implement modern, event-driven architectures.
Looker and BigQuery Omni on Microsoft Azure
Research on multi cloud adoption is unequivocal — 92% of businesses in 2021 report having a multi cloud strategy. We want to continue supporting your choice by providing the flexibility you need to see your strategy through.
- This past month, we introduced Looker, hosted on Microsoft Azure. For the first time, you can now choose Azure, Google Cloud, or AWS for your Looker instance. You can also self-host your Looker instance on-premises.
- We also introduced BigQuery Omni for Azure, which along with last year’s introduction of BigQuery Omni for AWS, will help you access and securely analyze data across Google Cloud, AWS, and Azure.
The cost of moving data between cloud providers isn’t sustainable for many, and it’s still difficult to seamlessly work across clouds. BigQuery Omni represents a new way of analyzing data stored in multiple public clouds, which is made possible by BigQuery’s separation of compute and storage. By decoupling these two, BigQuery provides scalable storage that can reside in Google Cloud or other public clouds, and stateless resilient compute that executes standard SQL queries.
- Unlike competitors, BigQuery Omni doesn’t require you to move or copy your data from one public cloud to another, where you might incur egress costs. You also benefit from the same BigQuery interface on Google Cloud, enabling you to query data stored in Google Cloud, AWS, and Azure without any cross-cloud movement or copies of data.
- BigQuery Omni’s query engine runs the necessary compute on clusters in the same region where your data resides. For example, you can query Google Analytics 360 Ads data stored in Google Cloud and query logs data from your ecommerce platform and applications that are stored in AWS S3 and/or Microsoft Azure.
Then, using Looker, you can build a dashboard that allows you to visualize your audience behavior and purchases alongside your advertising spend.
Dataplex
We understand that most organizations still struggle to make high-quality data easily discoverable and accessible for analytics, across multiple silos, to a growing number of people and tools within their organization.
They are often forced to make tradeoffs. For instance, moving and duplicating data across silos to enable diverse analytics use cases or leaving their data distributed but limiting the agility of decisions.
- Dataplex provides an intelligent data fabric that enables you to centrally manage, monitor, and govern your data across data lakes, data warehouses, and data marts, while also ensuring data is securely accessible to a variety of analytics and data science tools.
- One of the core tenets of Dataplex is letting you organize and manage your data in a way that makes sense for your business, without data movement or duplication. For that, we provide logical constructs like lakes, data zones, and assets. These constructs enable you to abstract away the underlying storage systems and become the foundation for setting policies around data access, security, lifecycle management, and so on.
- For example, you can create a lake per department within your organization (e.g. Retail, Sales, Finance, etc.) and create data zones that map to data readiness and usage (e.g. landing, raw, curated_data_analytics, curated_data_science, etc.).
Once you have your lakes and zones setup, you can attach data to these zones as assets. You can add data from different types of storage (e.g. GCS Bucket and BigQuery dataset) under the same zone. You can also attach data across multiple projects under the same zone. You can ingest data into your lakes and zones using the tools of your choice, including services such as Dataflow, Data Fusion, Dataproc, Pub/Sub, or choose from one of our partner products. Dataplex comes with built-in 1-click templates for common data management tasks.
To find out more about Dataplex, head to cloud.google.com/dataplex or watch the video below:
https://youtube.com/watch?v=bbFeAt7cw1g%3Fenablejsapi%3D1%26
Helping you innovate everyday
Sharing data is hard. Traditional data sharing techniques use batch data pipelines that are expensive to run, create late arriving data, and can break with any changes to the source data. These techniques also create multiple copies of data, which brings unnecessary costs and can bypass data governance processes. They also fail to offer features for data monetization, such as managing subscriptions and entitlements. Altogether, these challenges mean that organizations are unable to realize the full potential of transforming their business with shared data.
Analytics Hub
To address these limitations, we are introducing Analytics Hub, a new fully managed service that helps organizations unlock the value of data sharing, leading to new insights and increased business value.
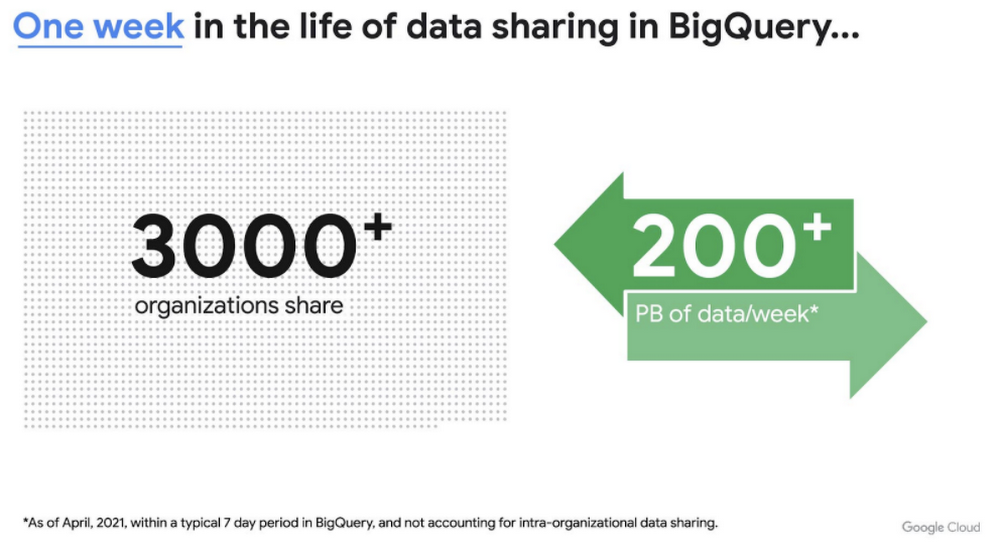
This new service is built on the tremendous experience and feedback we have received over the years. For example, BigQuery has had cross-organizational, in-place data sharing capabilities since its inception in 2010—and the functionality is very popular. Over a 7-day period in April, we had over 3,000 different organizations sharing over 200 petabytes of data. These numbers don’t include data sharing between departments within the same organization.
Analytics Hub takes sharing to the next level, making it easy for you to publish, discover, and subscribe to valuable datasets that you can combine with your own data to derive unique insights.
This includes:
- Shared datasets: As a data publisher, you create shared datasets that contain the views of data that you want to deliver to your subscribers. Data subscribers can search through the datasets that are available across all exchanges for which they have access and subscribe to relevant datasets. In addition, the publisher can track subscribers, disable subscriptions, and see aggregated usage information for the shared data.
- Curated, self-service data exchanges: Exchanges are collections used to organize and secure shared datasets. By default, exchanges are completely private, but granular roles and permissions make it easy to deliver data to the right audience—whether internal or public.
This is just the beginning for Analytics Hub. Please sign up for the preview, which is scheduled to be available in the third quarter of 2021.
Dataflow Prime
At Google Cloud, we have the great privilege of working with some of the most innovative organizations in the world. And this work provides us with a unique perspective into the future of big data processing. Dataflow Prime is a new platform based on a serverless, no-ops, and auto-tuning architecture that brings unparalleled resource utilization and radical operational simplicity to big data processing. This new service introduces a large number of exciting capabilities but I’d like to highlight three key aspects of the product:
- Vertical Autoscaling: Dataflow Prime dynamically adjusts the compute capacity allocated to each worker based on utilization, detecting when jobs are limited by worker resources and automatically adding more resources. Vertical Autoscaling works hand in hand with Horizontal Autoscaling to seamlessly scale workers to best fit the needs of the pipeline. As a result, it no longer takes hours or days to determine the perfect worker configuration to maximize utilization.
- Right Fitting: Each stage of a pipeline typically has a different resource requirement than the others. Until now, either all workers in the pipeline would have had the higher memory and GPU, or none of them would. Pipelines either had to waste resources or suffer slower workloads. Right Fitting solves this problem by creating stage-specific pools of resources, optimized for each stage.
- Smart Recommendations: Smart Recommendations automatically detects problems in your pipeline and shows potential fixes. For example, if your pipeline is running into permissions issues, a Smart Recommendation will detect which IAM permissions you need to enable to unblock your job. If you are using an inefficient coder in your job, Smart Recommendations will surface more performant coder implementations that can help you save on costs.
What’s next
We’re excited to hear your thoughts and feedback about all these exciting new services. I would also highly recommend that you connect with members of the community to learn more about their story and journey. A good example to start with is the Data To Value customer panel we produced at our inaugural Data Cloud Summit with the Chief Data Officers of Keybank and Rackspace. You can watch it for free below:
https://youtube.com/watch?v=ITI2Q3MkxuA%3Fenablejsapi%3D1%26
More Relevant Stories for Your Company

How Constellation Brands’ Direct-to-Customer Tech Delivers Economic Impact across Business Portfolio
Editor’s note: Today we’re hearing from Ryan Mason, Director, Head of DTC Growth & Strategy, at alcoholic beverage firm, Constellation Brands on the company’s shift to Direct-to-Consumer (DTC) sales and how Google Cloud’s powerful technology stack helped with this transformation. It’s no secret that consumer businesses have been up-ended in

Unlocking Data Value: Latest Data Platforms and Announcements at the Next 21
Today at Google Cloud Next we are announcing innovations that will enable data teams to simplify how they work with data and derive value from it faster. These new solutions will help organizations build modern data architectures with real-time analytics to power innovative, mission-critical, data-driven applications. Too often, even the best minds

Candidate360: Google Cloud and Deloitte Product Improves Universities’ Enrollment and Admission Processes
Given the May 1 deadline for students to enroll, colleges and universities have been carefully watching the numbers of students who put down deposits and commit to a school. Like nearly every other sector in the U.S., colleges and universities have been hit hard by the pandemic and economic downturn,

A Breakdown of Cloud-based Data Ingestion Practices
Businesses around the globe are realizing the benefits of replacing legacy data silos with cloud-based enterprise data warehouses, including easier collaboration across business units and access to insights within their data that were previously unseen. However, bringing data from numerous disparate data sources into a single data warehouse requires you
