





Google Cloud Helps LiveRamp Capture, Manage, Process and Visualize Data at Scale

4929
Of your peers have already read this article.
2:30 Minutes
The most insightful time you'll spend today!
Editor’s note: Today we’re hearing from Sagar Batchu, Director of Engineering at LiveRamp. He shares how Google Cloud helped LiveRamp modernize its data analytics infrastructure to simplify its operations, lower support and infrastructure costs and enable its customers to connect, control, and activate customer data safely and securely.
LiveRamp is a data connectivity platform that provides best in class identity resolution, activation and measurement for customer data so businesses can create a true customer 360 degree view. We run data engineering workloads at scale, often processing petabytes of customer data every day via LiveRamp Connect platform APIs.
As we integrated more internal and external APIs and the sophistication of our product offering grew, the complexity of our data pipelines increased. The status quo for building data pipelines very quickly became painful and cumbersome as these processes take time and knowledge of an increasingly complex data engineering stack. Pipelines became harder to maintain as the dependencies grew and the codebase became increasingly unruly.
Beginning last year, we set out to improve these processes and re-envision how we reduce time to value for data teams by thinking of our canonical ETL/LT analytics pipelines as a set of reusable components. We wanted teams to spend their time adding new features which encapsulate business value rather than spending time figuring out how to run workloads at scale on cloud infrastructure. This was even more pertinent with data science, data analyst and services teams whose daily wheelhouse was not the nitty gritty of deploying pipelines.
With all this in mind, we decided to start a data operations initiative, a concept popularised in the last few years, which aims to accelerate the time to value for data-oriented teams by allowing different personas in the data engineering lifecycle to focus on the “what” rather than the “how.”
We chose Google Cloud to execute on this initiative to speed up our transformation. Our architectural optimizations, coupled with Google Cloud’s platform capabilities simplified our operational model, reduced time to value, and greatly improved the portability of our data ecosystem for easy collaboration. Today, we have ten teams across LiveRamp running hundreds of workloads a day, and in the next quarter, we plan to scale to thousands.
Why LiveRamp Chose Google Cloud
Google Cloud provides all the necessary services in a serverless fashion to build complex data applications and run massive infrastructure. Google Cloud offers data analytics capabilities that help organizations like LiveRamp to easily capture, manage, process and visualize data at scale. Many of the Google Cloud data processing platforms also have open source roots making them extremely collaborative. One such platform is CDAP (Cask Data Application Platform), which Cloud Data Fusion is built on. We were drawn to this for the following reasons:
- CDAP is inherently multicloud. Pipeline building blocks known as Plugins define individual units of work. They can be run through different provisioners which implement managed cloud runtimes.
- The control plane is a set of microservices hosted on Kubernetes, whereas the data plane leverages the best of breed big data cloud products such as Dataproc.
- It is built as a framework and is inherently extensible, and decoupled from the underlying architecture. We can extend it both at the system and user-level through “extensions” and “plugins” respectively. For example, we were able to add a system extension for LiveRamp specific authorisation and build a plugin that encompasses common LiveRamp identity operations.
- It is open sourced, and there is a dedicated team at Google Cloud building and maintaining the core codebase as well as a growing suite of source, transform and sink connectors.
- It aligns with our remote execution and non-data movement strategy. CDAP executes pipelines remotely and manages through a stream of metadata via public cloud APIs.
- CDAP supports an SRE mindset by providing out of the box monitoring and observability tooling.
- It has a rich set of APIs backed by scalable microservices to provide ETL as a Service to other teams.
- Cloud Data Fusion, Google Cloud’s fully managed, native data integration platform is based on CDAP. We benefit from the managed security features of Data Fusion like IAM integration, customer manager encryption keys, role based access controls and data residency to ensure stricter governance requirements around data isolation.
How are teams using the Data Operations Platform?
Through this initiative, we have encouraged data science and engineering teams to focus on business logic and leave data integrations and infrastructure as separate concerns. A centralised team runs CDAP as a service, and custom plugins are hosted in a democratized plugin marketplace where any team can contribute their canonical operations.
Adoption of the platform was driven by one of our most common patterns of data pipelining: The need to resolve customer data using our Identity APIs. LiveRamp Identity APIs connect fragmented and inaccurate customer identity by providing a way to resolve PII to pseudonymous identifiers. This enables client brands to connect, control, and activate customer data safely and securely.
The reality of customer data is that it lives in a variety of formats, storage locations, and often needs bespoke cleanup. Before, technical services teams at LiveRamp had to develop expensive processes to manage these hygiene and validation processes even before the data was resolved to an identity. Over time, a combination of bash and python scripts and custom ETL pipelines became untenable.

By implementing our most used Identity APIs, a series of CDAP plugins, our customers were able to operationalise their processes by logging into a Low Code user interface, select a source of data, run standard validation and hygiene steps, visually inspect using CDAP’s Wrangler interface for especially noisy cases, and channel data into our Identity API. As these workflows became validated, they have been established as standard CDAP pipelines that can now be parameterized and distributed on the internal marketplace. These technical services teams have not only reduced their time to value but have also enabled future teams to leverage their customer pipelines without worrying about the portability to other team’s infrastructures.
What’s Next ?
With critical customer use cases now powered by CDAP, we plan on scaling out usage of the platform to the next batch of teams. We plan on taking on more complex pipelines, cross-team workloads, and adding support for the ever growing LiveRamp platform API suite.
In addition to the Google Cloud community and the external community, we have a growing base of LiveRamp developers building out plugins on CDAP to support routine transforms and APIs. These are used by other teams who push the limits and provide feedback — spinning a flywheel of collaboration between those who build and those who operate. Furthermore, teams internally can continue to use their other favorite data tools like BigQuery and Airflow as we continue to deeply integrate CDAP into our internal data engineering ecosystem.
Our data operations platform powered by CDAP is quickly becoming a center point for data teams – a place to ingest, hygiene, transform, and sink their data consistently.
We are excited by Google Cloud’s roadmap for CDAP and Data Fusion. Support for new execution engines, data sources and sinks, and new features like Datastream and Replication will mean LiveRamp teams can continue to trust that their applications will be able to interoperate with the ever evolving cloud data engineering ecosystem.
3045
Of your peers have already watched this video.
19:30 Minutes
The most insightful time you'll spend today!
How to Manage Data Governance, at Scale, in a Multi-cloud World
Fears around security, data loss and regulatory compliance are still some of the largest reasons holding back enterprises from embracing the cloud.
In a hybrid or multi-cloud paradigm, how do you avoid data access bottlenecks, security blindspots, data leakage, or missed opportunities? Restricting access to data and tightening data security, if done haphazardly, can quickly slow down innovation or decision-making support. Conversely, liberating all data can quickly result in liability issues.
There is a fine balance, an art, to leveraging data governance as a business driver. Imagine discovering and gaining access to what you don’t already know, turning your data intranet into a privacy-sensitive data internet.
In this video, Evren Eryurek, Director, Product Management, Google Cloud; and Jim Cushman, Chief Product Officer, Collibra, show how the partnership between Google Cloud and Collibra opens the aperture for enacting a successful data governance strategy at scale, no matter where your data resides.
Wayfair Writes its Success Story with BigQuery for Internal Analytics

4946
Of your peers have already read this article.
4:00 Minutes
The most insightful time you'll spend today!
Editor’s note: Home-goods and furniture giant Wayfair first partnered up with Google Cloud to transform and scale its storefront—work that proved its value many times over during the unprecedented surge in ecommerce traffic during 2020. Today, we hear how BigQuery’s performance and cost optimization have transformed the company’s internal analytics to create an environment of “yes”.
At Wayfair, we have several unique challenges relating to the scale of our product catalog, our global delivery network, and our position in a multi-sided marketplace that supports both our customers and suppliers. To give you a sense of our scale we have a team of more than 3,000 engineers with tens of millions of customers. We supply more than 20 Million items using more than 16,000 supplier partners.
Serving those constituents generates a lot of analytics work. Wayfair runs over a billion ‘analytic’ database queries a year, from both humans and systems, against multi-petabyte datasets. Scaling our previous environment to meet these challenges required us to maintain dozens of copies of data for different use cases and manage complex data synchronization routines to move trillions of records each day, resulting in long development times and high support costs for our analytics projects.
Centralizing our data using Cloud Storage and BigQuery enabled us to break down existing silos and build unified pipelines for our batch and real-time operations. BigQuery shines by letting us decouple our compute and storage resources and flexibly ingest structured data in streaming and batch modes. We also benefit from the same decoupling for more complicated machine learning (ML) workflows in Dataproc and Cloud Storage. In particular, BigQuery is extremely low maintenance. From ML and easy data integrations to the integrated query cache, many out-of-the-box features have proven valuable for multiple use cases.
Beyond storage and compute, Google Cloud offers multiple tools to maximize the value of our data. For example, we can easily connect Data Studio to BigQuery for lightning-fast dashboarding of enterprise KPI reporting. When we need to dive deeper into a metric, Looker provides an interface and semantic model that empowers more business users to answer important questions — without understanding SQL or our vast dataset and table structure.
The combination of all of Google Cloud’s tools enables every Wayfairian the opportunity to self-serve their data visualization and analysis needs. We are able to support all of the requirements of our internal and external users, from descriptive analytics to alerting and ML, in a platform that blends Google’s proprietary technology with open-source standards.we have seen a greater than 90% reduction in the number of analytic queries in production that take more than one minute to run
As a result, we have seen a greater than 90% reduction in the number of analytic queries in production that take more than one minute to run, which delights our users and increases adoption of our analytics tools across the business.
Higher performance means saying “Yes” more often
We went into the BigQuery experience expecting very strong performance on large, aggregate queries and excellent scalability — the kind of performance that could enable consistent 5-15 minute processing queries and 5-10 second response times for large analytics queries.
We weren’t disappointed — we saw slightly better than linear performance profiles as record counts went up from millions to trillions for a flat resource allocation. BigQuery had the expected high performance for aggregate queries. This made our large data processing pipelines predictable and straightforward to maintain and optimize.
Below is a plot of gigabytes processed by a query against query run time in seconds; outliers are filtered and the axes are pruned to ranges where we had a large sample size. This focuses on longer-duration queries. As an example of the linear performance, a 2 terabyte query averages 5 minutes — 2.5min/terabyte — and an 18 terabyte query (9 times as much data) averages 25s — only 1.4min/terabyte. This is despite the fact that complex queries [sorting and analytic functions are particularly problematic] are more common with large data sizes. We do see increasing variability at large sizes as slot limits and other resource constraints come into play, but these factors are controllable and ultimately a business optimization decision.
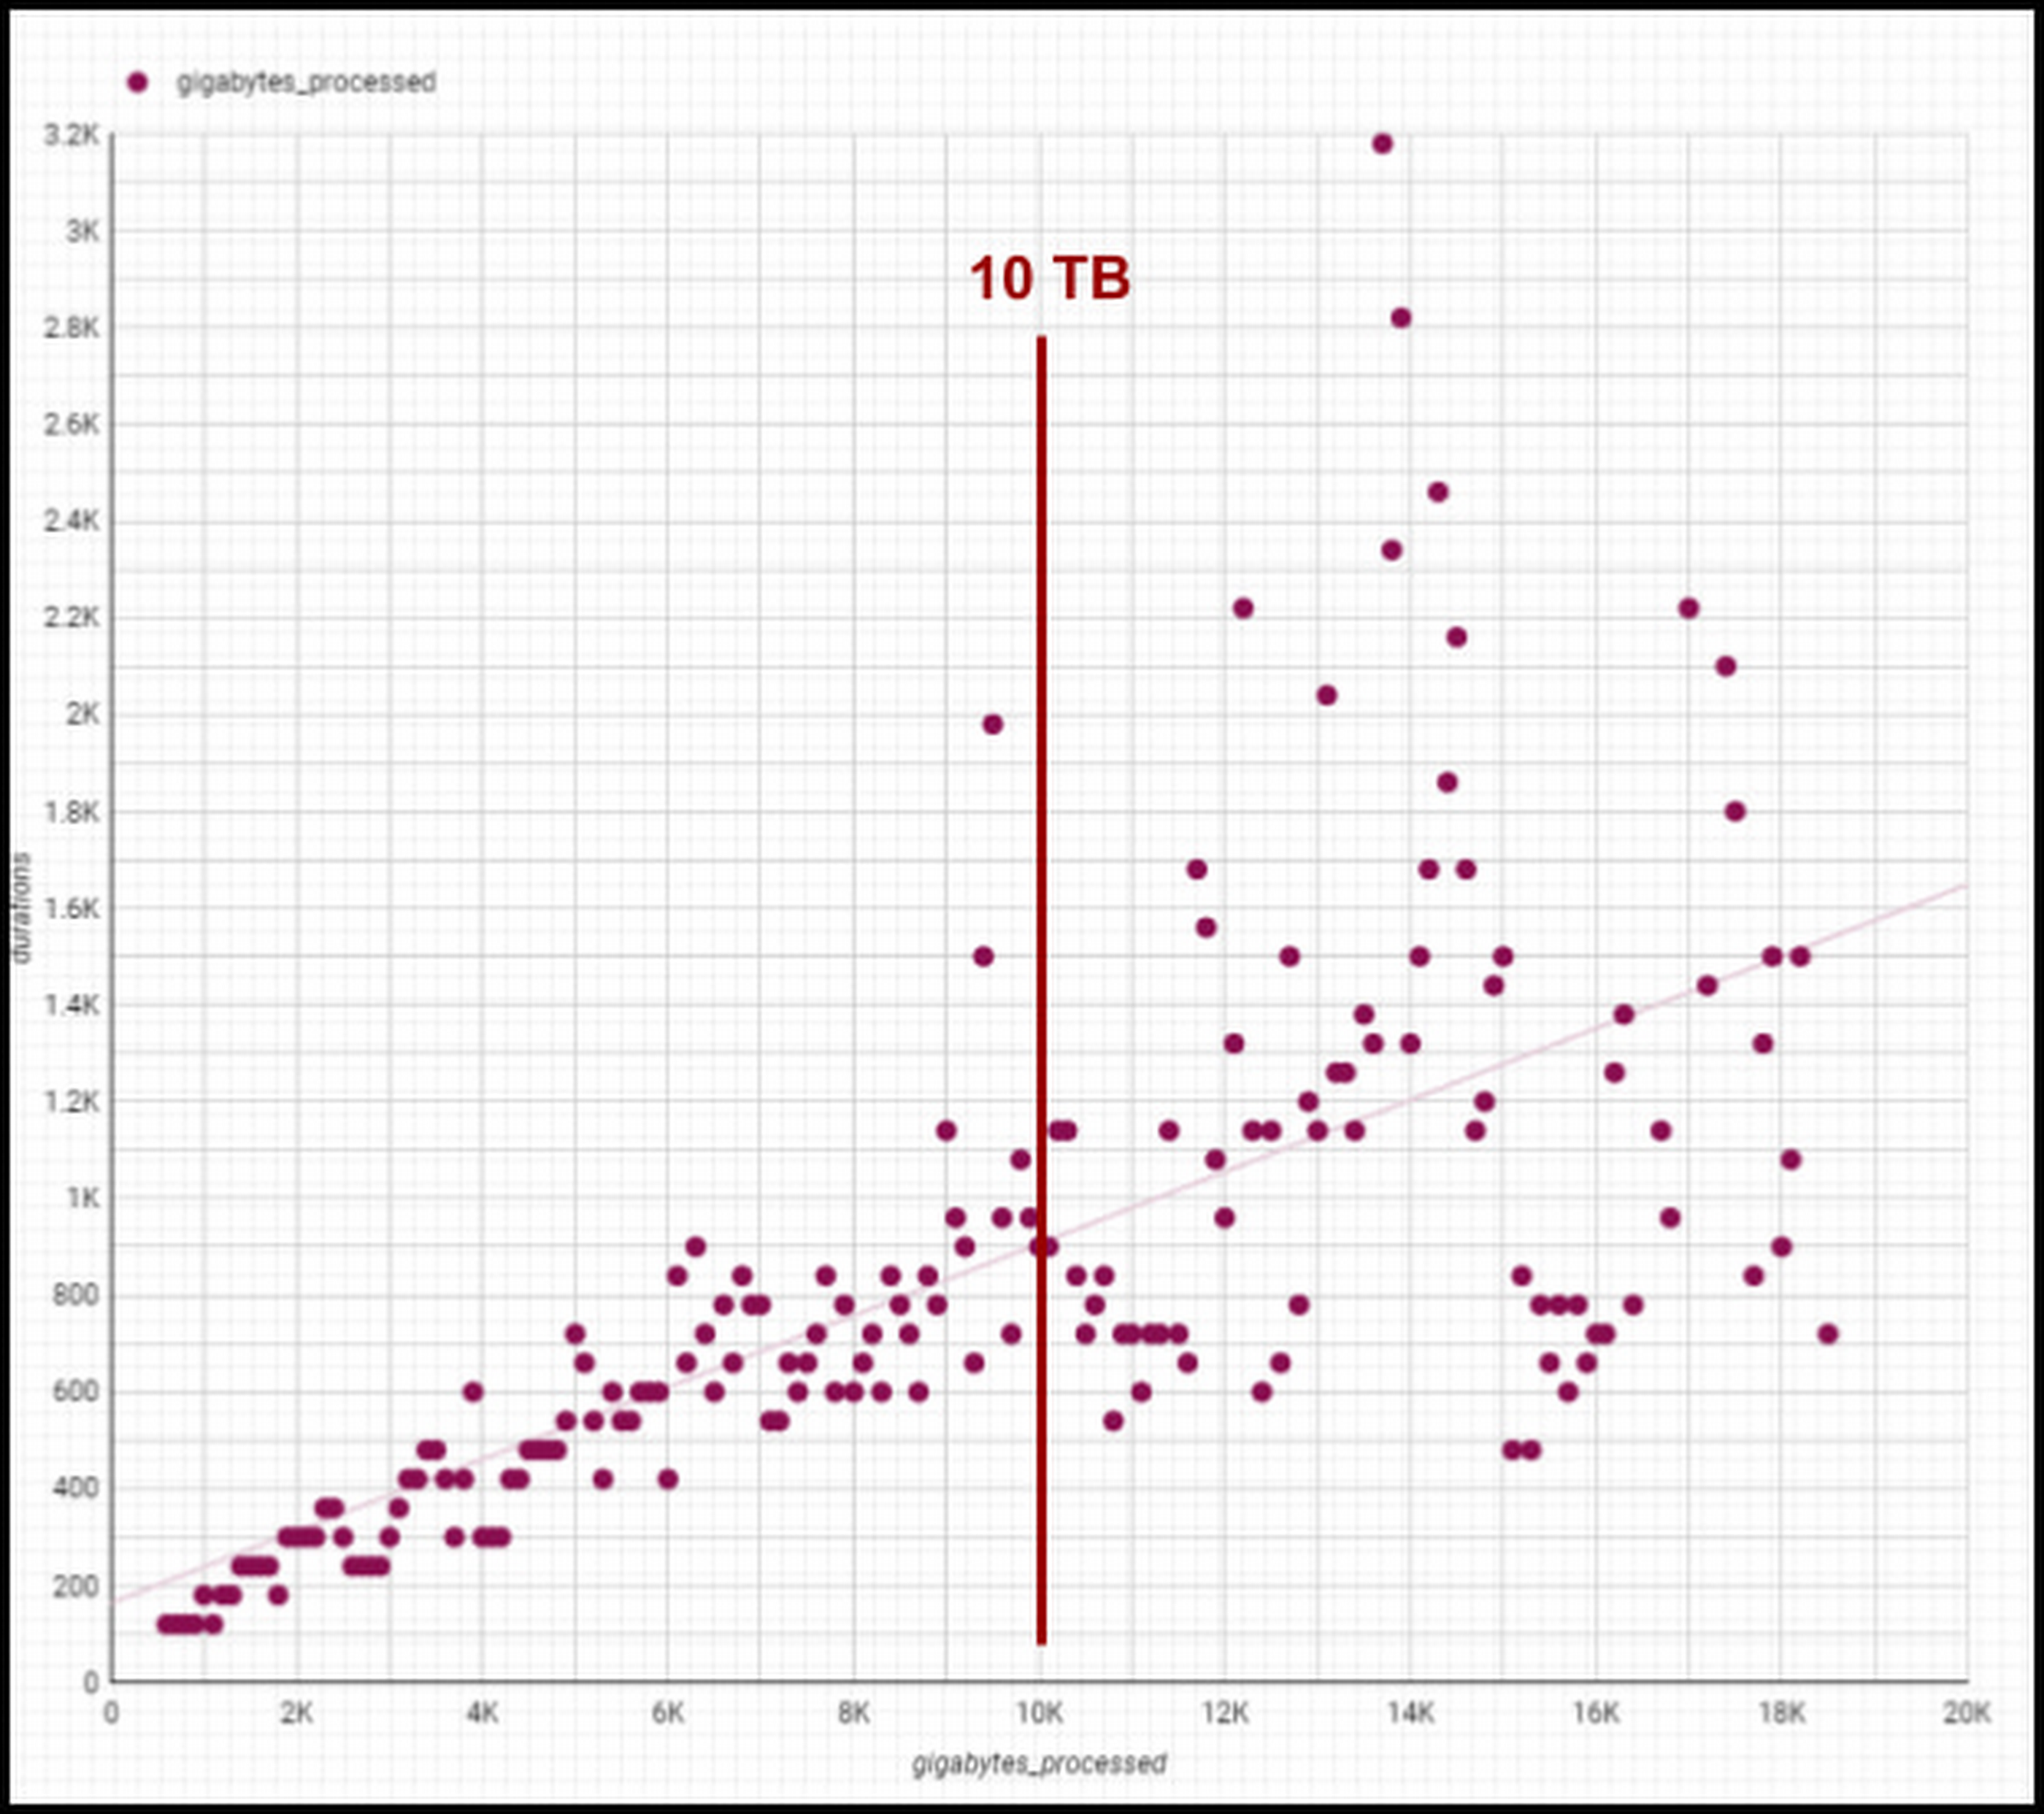
Though individual values vary greatly depending on query complexity [analytic functions/sorting can be computationally expensive], the overall trend line is below 1-1 for bytes versus duration, meaning our BigQuery query runtimes are increasing slower than our data volumes. We are still seeing sub 1:1 threshold runtimes, and we’re already at 100 PB of total data with single queries running on 50PB or more. Going strong!
One unexpected and pleasant surprise has been high performance for smaller queries, such as those required for development, interactive analytics, and internal applications we use for forecasting, segmentation, and other latency-sensitive data workflows. BigQuery’s resource management systems have provided smoother degradation and parallelism profiles than we initially expected for a multi-tenant platform.
We regularly see sub-second p50 query performance for interactive use cases, with p90 performance coming in under 10 seconds for Looker, Data Studio, and AtScale — meeting the threshold we set to avoid analysts losing focus during a business investigation. The chart below shows p50, p90, and p95 timing for core workloads, as well as the number of queries in each bucket and the number of unique users. [Looker and Atscale will use small numbers of service accounts for a large number of users].

This has enabled two important shifts in the way our customers experience analytics services:
- Delivering better user productivity. People no longer have long wait times to get results for a basic query delivering an improved overall user experience.
- Scaling our data transformation. BigQuery has proven, effective data transformation that allows us to embrace the industry shift away towards ELT (extract, load, transform) to transform raw data right within the database.
We no longer have to ask ourselves, “Can we meet the SLA for this data processing task?” The new conversation is, “Of course, we can meet it. What’s the associated cost based on how many resources we assign?” We can make cost and resource trade-offs clear to our users and say “yes” more often to requirements that have measurable business value.
Supporting cost vs. performance decisions
Democratized access to internal analytics is a powerful decision-making tool. With BigQuery’s robust tooling, the decision about how to best allocate computational resources is in the hands of the analytics groups closest to the business decision being made. If they want to spend a sprint optimizing a dashboard, they can show exactly how much money it will save. If they choose not to optimize a report, they can offset the decision with concrete cost savings and other realized value.
Wayfair teams also benefit from visibility into their committed costs by abstracting away the details of the underlying services, including BigQuery slots, the virtual CPUs used to execute SQL queries.
Take a look at this example view consumed by our teams (the metrics for these dashboards are from the BigQuery INFORMATION_SCHEMA (jobs and reservations tables):
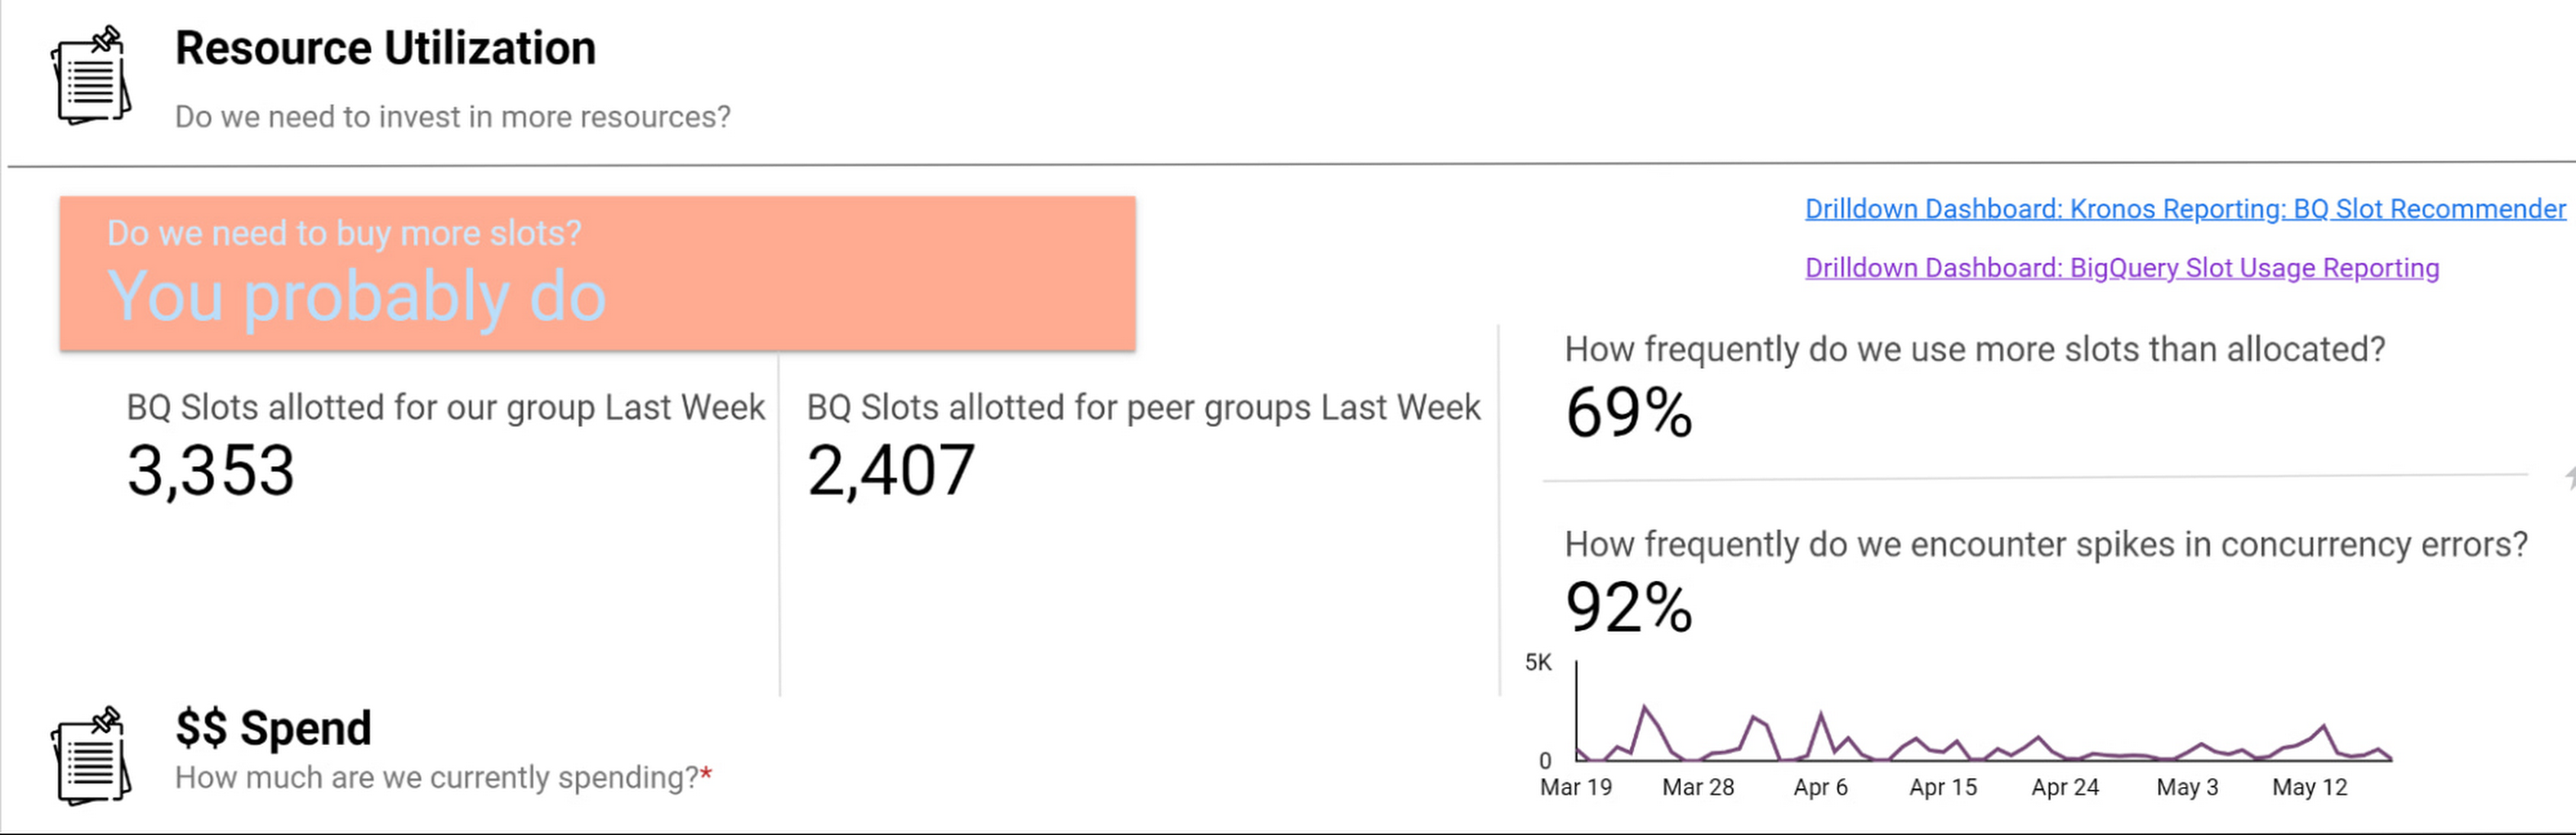
Suppose an organization wants to purchase capacity for a period of time. In that case, we provide an average cost for a slot during that time and charge them based on their slot usage for queries, multiplied by the average price.
Teams can see whether their consumption matches their reservations with a consistent, high-level number. We apply the same approach to tools like Dataproc by aggregating up the costs of component services and providing an organizational cost for those services.
How we use performance signals to improve user efficiency
Instead of overcorrecting for occasional performance fluctuations by allocating excessive resources, we try to align incentives so that people make the right choices for the business. Showback doesn’t work in a vacuum — it requires context and integrated insights. Teams need to show the cost of running a dashboard as well as the ROI is in terms of end user engagement and what peer dashboards with equivalent source datasets might cost.
We want to give users the freedom to do things the way they want and need to while also educating them on achieving their goals and using best practices to reduce their costs and improve their performance. The goal is never for all dashboards to load “less than x seconds” — we believe that any dashboard can load in x seconds when it is properly designed and resourced.
For instance, BigQuery allocates slots for a new workload quickly and efficiently, and queries that are optimized and have dedicated resources consistently complete quickly. When users experience a slowdown, it’s typically because they are sharing resources or inefficiently using their resources. Variable performance is a useful signal to help users discover opportunities to optimize queries and work more productively. We value these signals as we like to focus on the aggregate experience of all users interacting with the tool, not individual interaction.
A natural way to improve user efficiency is to reward ideal behaviors and discourage those that do not align with our analytics strategy. Some examples include splitting out high-demand reporting from ad-hoc exploration to reduce concurrency errors or encouraging people to use materialized tables instead of writing complex custom SQL. For instance, a dedicated reporting project might only include an organization’s Data Studio dashboard if it directly references a table or meets other optimization requirements. Using this approach, we give our users a high degree of freedom and experimentation at the entry-level while providing a well-documented path to scale.
Visibility into query performance improves business performance
The detailed tracking information we get from Google Cloud products is critical — Google’s robust analytics performance has enabled us to scale Data Studio to over 15,000 Wayfarians. Of course, a larger user base always comes with concerns that less sophisticated users may not appropriately optimize their queries or make the best use of the infrastructure.
Evaluating the different Data Studio dashboards helps us identify opportunities to use better query optimization practices, such as reducing custom queries, connecting directly to permanent tables, or using the BI Engine to improve dashboard performance. Recently, our team built new billing projects specific for Data Studio reporting. We can scale up a reservation dedicated to reporting about a major sales event in minutes.
Beyond everyday reporting, holidays and sales events may require higher, guaranteed performance. BigQuery’s flexible capacity commitments allow us to decide at a business level whether an urgent need requires us to reprioritize resources immediately or whether we have the time to optimize queries and rebuild dashboards to be performant. These new billing projects let us evaluate if teams need to scale up resourcing, what areas they can optimize in BigQuery, or if a new reservation is needed to resource that team separately.
Recommendations for achieving high performance at low cost
Are you wondering how to allocate BigQuery slots? Teams must see direct, immediate return on their investment in performance and optimization.
Our first rule of thumb is to align resource utilization with ownership as closely as possible. This makes it easier for teams to secure dedicated resources, even if they start out small. We’re comfortable doing this because BigQuery dynamically reassigns capacity between the targeted reservation and other consumers in milliseconds. We always get the total usage of our slots — there is no wasted capacity even when we break assignments down granularly.
Once a team has a reservation, we provide reporting that consumes various BigQuery information schema views, such as query logs and reservation information, and processes it into aggregated reporting. We look for metrics like the average slots available to a query at a point in time, overall query performance, and how long queries took to execute to pinpoint the overall health of a reservation against our business objectives. Flex slots also let us experiment easily with additional capacity, and BigQuery’s performance is so consistent that we can use straightforward models to estimate return on additional slot investment.
Other key cost optimization tips we have found helpful at Wayfair include:
- Optimize for worst-case performance. Given BigQuery’s ability to share slots, we expect teams will often see much better performance, but we find that thinking it’s more effective when teams think about the most pessimistic case when resourcing their jobs.
- Take advantage of BI Engine reservations. We like to think critically about the data and workload. BI Engine reservations are excellent for workloads that query lots of small dimension tables or a few larger tables loaded into memory. In cases like that, such as with OLAP tools using pre-computed aggregates, we’ve seen BI engine investments drive a 25% reduction in average query time—excellent ROI.
- Leverage Looker for large, longitudinal datasets. Since Looker supports a wide range of use cases, we see a broader range of performance — p50 is still under a second, but p95 can get as high as a minute. For these cases, we recommend modeling user patterns [first of month, first day of week] and dynamically allocating more slots for these periods while deprioritizing batch workloads in the key windows.
- Lean in heavily on the BQ cache for broad-based reporting. To avoid a Monday morning reporting lag, We use the BigQuery cache to avoid Monday morning report loading lags. Up to 30% of our Data Studio queries hit the BQ cache, ensuring our Data Studio p95 consistently stays under 10 seconds.
- Use slots-per-job to improve experience. In our reporting, we find that the most valuable view is slots-per-job. We look for dips in slots available for jobs as this situation often correlates strongly with poor user experiences. For example, our reporting showed us that Looker has the highest volumes of queries and users on Mondays and during each month’s first two business days. We used this information to scale up slots to support these periods of highest demand, delivering on performance SLAs to support business users.

- Get a global picture of usage. We manage slots in a central tool. Teams input their requirements into a calendar to indicate when they want higher or lower capacity to inform our flex slot purchases and annual commitments. It might seem like dozens of relatively inconsistent workloads at the team level, but the picture changes when you look at demand across a week (or our entire business). Understanding global usage makes it easy for us to model baseline capacity recommendations for serving year slots versus flexible demands.
Reaping the rewards of BigQuery
From our first initial undertaking with Google Cloud to transform our storefront, we had a lot of confidence in the underlying technology offerings and the teams that ran them and their ability to meet our unique requirements. But our experience using BigQuery for internal analytics at Wayfair has exceeded our already high expectations.
BigQuery’s fast, dynamic allocation of resources and ability to transform data in place are important to our mission of maintaining consistently high performance for our users while closely managing costs. Moreover, our visibility into query and dashboard performance through BigQuery’s DSP views and other performance metrics have helped us make clearer connections between performance goals and the costs required to meet them — and guide our analysts across the company towards attaining high performance on every project.

7538
Of your peers have already downloaded this article
15:52 Minutes
The most insightful time you'll spend today!
Breakthroughs in artificial intelligence (AI) have captured the imaginations of business and technical leaders alike. The AI techniques underlying these breakthroughs are finding diverse application across every industry. Early adopters are seeing results, particularly encouraging is that AI is starting to transform processes in established industries, from retail to financial services to manufacturing.
However, an organization’s effectiveness in applying these breakthroughs is anchored in the basics: A disciplined foundation in capturing, preparing and analyzing data.
Data scientists spend up to 80% of their time on the “data wrangling,” “data munging” and “data janitor” work required well before the predictive capabilities promised by AI can be realized.
Capturing, preparing and analyzing data creates the foundation for successful AI initiatives. To help business and IT leaders create this virtuous cycle, Google Cloud has prepared a CIO’s guide to data analytics and machine learning that outlines key enabling technologies at each step. Crucially, the guide illustrates how managed cloud services greatly simplify the journey—regardless of an organization’s maturity in handling big data.
This is important because, for many companies, the more fundamental levels of data management present a larger challenge than new capabilities like AI. “Management teams often assume they can leapfrog best practices for basic data analytics by going directly to adopting artificial intelligence and other advanced technologies,” noted Oliver Wyman consultants Nick Harrison and Deborah O’Neill in a recent Harvard Business Review article (aptly titled If Your Company Isn’t Good at Analytics, It’s Not Ready for AI). “Like it or not, you can’t afford to skip the basics.
Building on new research and Google Cloud’s own contributions to big data since the beginning, this guide walks readers through each step in the data management cycle, illustrating what’s possible alongside examples.
Specifically, the CIO’s guide to data analytics and machine learning is designed to help business and IT leaders address some of the essential questions companies face in modernizing data strategy:
- For my most important business processes, how can I capture raw data to ensure a proper foundation for future business questions? How can I do this cost-effectively?
- What about unstructured data outside of my operational/transactional databases: raw files, documents, images, system logs, chat and support transcripts, social media?
- How can I tap the same base of raw data I’ve collected to quickly get answers as new business questions arise?
- Rather than processing historical data in batch, what about processes where I need a real-time view of the business? How can I easily handle data streaming in real time?
- How can I unify the scattered silos of data across my organization to provide a current, end-to-end view? What about data stored off-premises in the multiple cloud and SaaS providers I work with?
- How can I disseminate this capability across my organization—especially to business users, not just developers and data scientists?
Because managed cloud services deal with an organization’s sensitive data, security is a top consideration at each step of the data management cycle. From data ingestion into the cloud, followed by storage, preparation and ongoing analysis as additional data flows in, techniques like data encryption and the ability to connect your network directly to the Google Cloud must reflect data security best practices that keep data assets safe as they yield insights.
Wherever your company is on its path to data maturity, Google Cloud is here to help. We welcome the opportunity to learn more about your challenges and how we can help you unlock the transformational potential of data.
How AI and ML Helps Interpret Baseball Fandom during this MLB Season

4559
Of your peers have already read this article.
1:30 Minutes
The most insightful time you'll spend today!
The game of baseball has no shortage of statistics — from batting average to exit velocity, strikeouts to wins above replacement. Among all sports, Major League Baseball (MLB) arguably contains the most analytical and data-driven participants and fan base. Subconsciously or viscerally, players and managers on the field and those following from anywhere are constantly assessing and making decisions based off of game play trends and expectations — whether a batter will come through with a hit in an important situation, when a pitcher should be pulled. Less analyzed, however, is what leads fans to become engaged with certain players or teams, and what factors drive their love of the game. This is the motivation behind the problem being posed by Major League Baseball in their Kaggle competition for Player Digital Engagement Forecasting. Can you use machine learning to deconstruct baseball fandom?
This competition asks you to predict measures of digital engagement for each active player on a daily basis during the MLB season. So, how large was the surge in fan interest after Joe Musgrove threw the first no-hitter in Padres history? Is Shohei Ohtani’s engagement higher when he pitches well, when he hits a monster home run…or when he does both? You’re provided a wealth of game, team and player information – detailed stats, awards, rosters, and transaction information – as well as social and digital engagement data as your inputs. Data scientists will recognize this as an exciting forecasting problem with both traditional regression and time series components, where having this input data just prior to the prediction date is critical to determining which players will receive the most engagement.
With so many variables in the game, there are an endless number of vectors which could possibly influence fan engagement. Eleven-time All-Star Miguel Cabrera delighted fans by hitting the first home run of the season – in the snow! Occasionally a lesser-known player like Musgrove or Carlos Rodón “wins the day” with an unlikely no-hitter. And sometimes just getting traded to an iconic franchise like the Yankees generates a ton of fan interest, like it did for Rougned Odor in early April.
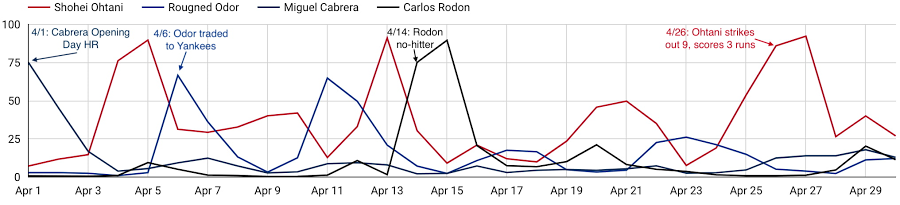
As these examples show, a player’s digital engagement can be pretty dynamic during the season, with many different potential contributors to who is “trending” on a given day. How can you use data to uncover which factors are the most influential of engagement with each player’s digital content?
Ready to play ball? Check out the competition on Kaggle for all the details. $50,000 in prizes is up for grabs in two prize categories. The code competition puts your machine learning skills to the test, to see who can build the most accurate forecasting models to predict daily digital engagement for every active player. You’ll have until July 31st to build your models and then be evaluated on a future time frame, which will determine the winners. For data visualization and exploration experts out there, the explainability prizes give you an opportunity to analyze more broadly which factors, even those outside of what we’re providing directly, most influence digital engagement. You’ll be evaluated on how well you can use what the data is telling you to support your findings.
And if you’re looking to get started, we’ve provided an introductory video and some notebook tutorials, including a starting point for harnessing the power of Vertex AI through tools including Cloud Notebooks, Explainable AI, and Vizier.
With the second half of the season upon us, it’s an exciting time to be an MLB fan. With this Kaggle competition, it’s also a perfect opportunity to use data science to help understand baseball fandom and potentially earn some of your own accolades in the process. Step up to the plate!
Major League Baseball trademarks and copyrights are used with permission of Major League Baseball. Visit MLB.com.
6546
Of your peers have already watched this video.
24:00 Minutes
The most insightful time you'll spend today!
Swarovski’s Journey towards Online and Offline Conversion with Predictive Analytics
Luxury brand and leader in crystals and glass production, Swarovski has charmed customers with its exquisite collections for over 125 years. To understand their customers better and map their online behaviors, Swarovski had to overcome prediction hurdles as majority of the purchases are not frequent or habitual. They are mostly impulse buys or have no rational behind the purchase in order for the brand to accurately map customers’ interest and delight them with relevant personalization or website customization strategy.
Swarovski used a machine learning (ML) model to predict the most performing SKUs and list of products based on both online and offline indicators to target buyers. A score was assigned to each product in the list and was personalized at the country level that delivered relevant insights. Swarovski is aiming to expand the product listing page to personalize at customer level. Watch the video to dive deep into Swarovski’s data analytics efforts to answer complex questions, reporting and prediction using both online and offline data.
More Relevant Stories for Your Company
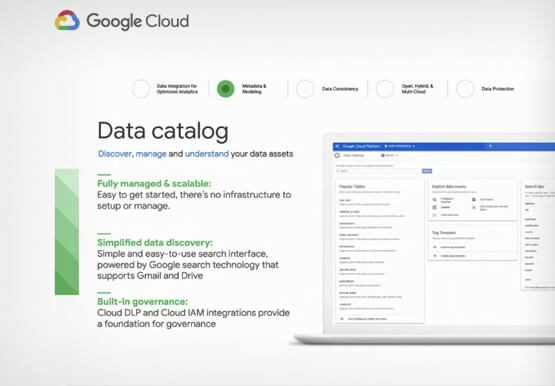
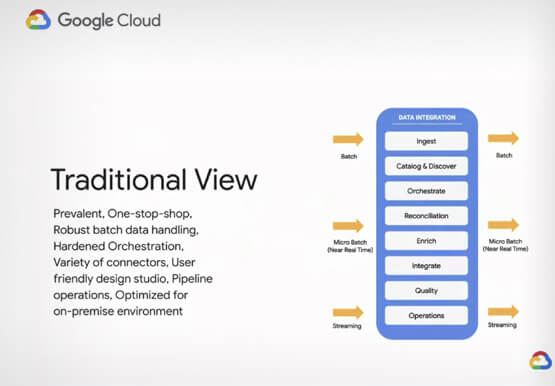

Real-world Data Integration Patterns
Learn the basics of Google Cloud Data Integration. How do you go from basic, hardcoded data pipelines to making your solution is dynamic and reusable? How do you parameterize your pipelines? What is the difference between parameters and variables, and when should you use them? Nidhi Modh, Product Manager, Google

A Breakdown of Cloud-based Data Ingestion Practices
Businesses around the globe are realizing the benefits of replacing legacy data silos with cloud-based enterprise data warehouses, including easier collaboration across business units and access to insights within their data that were previously unseen. However, bringing data from numerous disparate data sources into a single data warehouse requires you


Why it’s Easier Than Ever for Developers to Break Into Machine Learning and Data Science
This week we talk about machine learning, its best use cases, and how developers can break into machine learning and data science. Dale Markowitz, Google Developer Advocate, talks about natural language processing as well, explaining that it’s basically the intersection of machine learning and text processing. It can be used

A Pre-ML Checklist That Will Save You Hours of Work
One of the toughest challenges for data scientists, and big data engineers is gathering, preparing, and transforming data, and creating data pipelines. Gathering data for a machine learning or big data initiative can be hard work. The mere act of getting it all together can leave data teams so excited
