





Can Your Company Use Video AI? You’d Be Surprised at the Answer

5750
Of your peers have already read this article.
4:30 Minutes
The most insightful time you'll spend today!
Video AI is a powerful way to enable content discovery and engaging video experiences.
Here, try it out right now!
Google Cloud’s easy-to-access video AI solutions can accomplish a bunch of things. Here are a few:
Precise video analysis: Video Intelligence API automatically recognizes more than 20,000 objects, places, and actions in stored and streaming video. It also distinguishes scene changes and extracts rich metadata at the video, shot, or frame level. Use in combination with AutoML Video Intelligence to create your own custom entity labels to categorize content. Imagine being able to categorise hundreds of videos of customer interactions quickly to improve service training!
Recommended content: Build a content recommendation engine with labels generated by Video Intelligence API and a user’s viewing history and preferences. This will simplify content discovery for your users and guide them to the most relevant content that they want.
Simplify media management: Find value in vast archives by making media easily searchable and discoverable. Easily search your video catalog the same way you search text documents. Extract metadata that can be used to index, organize, and search your video content, as well as control and filter content for what’s most relevant.Imagine being able to locate insight in hundreds of enterprise videos to improve productivity and customer experience!
Easily create intelligent video apps: Gain insights from video in near real time using the Video Intelligence Streaming Video APIs, and trigger events based on objects detected. Build engaging customer experiences with highlight reels, recommendations, interactive videos, and more. Marketers, imagine being able to trigger a customer workflow, in real time, based on a live customer interactions.
Automate expensive workflows: Reduce time and costs associated with transcribing videos and generating closed captions, as well as flagging and filtering inappropriate content.
Content moderation: Identify when inappropriate content is being shown in a given video. You can instantly conduct content moderation across petabytes of data and more quickly and efficiently filter your content or user-generated content.
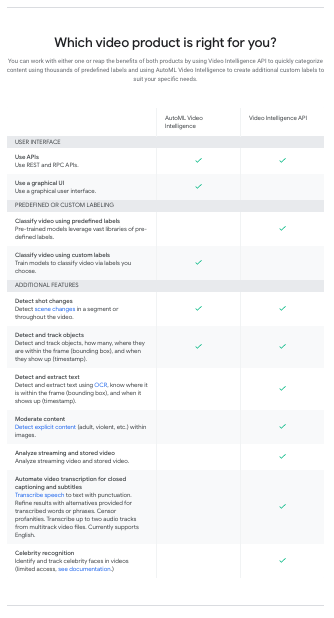
What can your organisation do with video AI?
6469
Of your peers have already watched this video.
1:30 Minutes
The most insightful time you'll spend today!
Value Realization with Google Cloud for Retail SAP Data
Retail engagements have changed drastically over the last few years, and by the virtue of COVID-19 pandemic, retail data and customers’ expectations plummeted. To drive value and transformation across the entire value-chain retailers can make most of Google Cloud’s secure, reliable IaaS by migrating their SAP systems and taking advantage of integrations, insights and innovations. In times of change retail companies can gain maximum visibility of SAP data unlocking Google Cloud’s infrastructure modernization and Big Data and analytics capabilities. Watch the video to understand how Google Cloud and SAP partnership is a golden handshake for retail businesses’ future.
How AI and Analytics in EdTech are Living Upto the Hype

4874
Of your peers have already read this article.
1:30 Minutes
The most insightful time you'll spend today!
Over the last year, COVID-19 presented unforeseen challenges for practically every type of business and organization—including schools, colleges, and universities. For educational institutions, the pandemic was an unapologetic agent of acceleration, shifting one billion learners from in-person to online learning within two months.
The rapid transition to online learning exposed many schools’ lack of readiness for the new online learning environment. It also widened the learning equity gap for students, with fewer than 40% of students from low-income families having access to the tools required for remote learning.
For those who do have online access, today’s students expect everything from engaging and collaborative digital learning experiences to skills-based training for their roles in the future workforce. Expectations are also high for 24×7 multi-channel tech support across all learning devices, applications, and platforms.
In these remarkable times, education technology companies have an important role to play in supporting academic institutions and students. Indeed, this is already happening, as the EdTech (Educational Technology) market is nearly tripling, with total global expenditures expected to reach $404 billion by 2025. However, the success of these EdTech companies depends on their performance in a number of areas, including:
- Content and products: How quickly can they generate new content and react to learner needs with new products to additional markets for broader adoption?
- Personalization: How effectively can they leverage artificial intelligence (AI) to provide a personalized experience to all types of learners?
- Trust and security: How trusted and secure are their services when educational organizations are suffering the highest number of data breaches since 2005?
Here are a few examples of how EdTech companies are successfully using AI and analytics to capture this opportunity and transform their businesses:
- Build better products: iSchoolConnect is an online platform that lets students explore schools, courses, and countries where they might study, and makes higher education admissions accessible to students around the globe. The company leverages AI services to help educational institutions optimize their academic operations by accelerating admission processing by greater than 90%, while saving significant costs.
- Launch in new markets faster: Classroom creativity tools provider Book Creator uses AI APIs to enhance accessibility and improve the learner experience. “The broad suite of intelligent APIs enables us to deliver richer experiences, faster and more easily, without having to be experts in machine learning, drawing recognition, map embeds, or other areas,” says VP of engineering Thom Leggett.
- Scale businesses securely: Using DevOps and CDN [content delivery network] services, Chrome browser recording extension creator Screencastify was able to support eight times growth in users overnight amid the COVID-19 pandemic, while maintaining consistent total cost of ownership. These technologies helped the company rapidly scale operations in response to the overnight increase in demand from consumers and assure student data privacy and security on a budget. “We know this is just the beginning, as more educators rely on technology to deliver richer, more interactive curricula to students,” says CEO James Francis.
- Provide personalized learning and support: Smart analytics and AI can provide personalized support and recommendations for students, forecast demand, and predict shifts in learners’ preferences. Online learning platform Mindvalley uses cloud-based tools to understand and make decisions based on user activity and leverage machine learning to predict behavior.
Google Cloud is partnering with many of these leading EdTech companies, as well as industry-leading consortiums like Ed-Fi and Unizin, to standardize educational common data models and best practices for more agile and cost-effective integration of EdTech into existing environments.
The education landscape is changing rapidly, and EdTech has a major role to play as institutions adapt to the massive shift in learners’ preferences and expectations. We’re committed to empowering EdTech companies with the tools and services they need to help expand learning for everyone, anywhere.
Watch our Spotlight session with EdTechX to learn more.
New Capabilities in BigQuery to Ease Anomalies Detection in the Absence of Labeled Data

6350
Of your peers have already read this article.
4:00 Minutes
The most insightful time you'll spend today!
When it comes to anomaly detection, one of the key challenges that many organizations face is that it can be difficult to know how to define what an anomaly is. How do you define and anticipate unusual network intrusions, manufacturing defects, or insurance fraud? If you have labeled data with known anomalies, then you can choose from a variety of supervised machine learning model types that are already supported in BigQuery ML. But what can you do if you don’t know what kind of anomaly to expect, and you don’t have labeled data? Unlike typical predictive techniques that leverage supervised learning, organizations may need to be able to detect anomalies in the absence of labeled data.
Today we are announcing the public preview of new anomaly detection capabilities in BigQuery ML that leverage unsupervised machine learning to help you detect anomalies without needing labeled data. Depending on whether or not the training data is time series, users can now detect anomalies in training data or on new input data using a new ML.DETECT_ANOMALIES function (documentation), with the following models:
- Autoencoder model, now in Public Preview (documentation)
- K-means model, already GA (documentation)
- ARIMA_PLUS time series model, already GA (documentation)
How does anomaly detection with ML.DETECT_ANOMALIES work?
To detect anomalies in non-time-series data, you can use:
- K-means clustering models: When you use
ML.DETECT_ANOMALIESwith a k-means model, anomalies are identified based on the value of each input data point’s normalized distance to its nearest cluster. If that distance exceeds a threshold determined by the contamination value provided by the user, the data point is identified as an anomaly. - Autoencoder models: When you use
ML.DETECT_ANOMALIESwith an autoencoder model, anomalies are identified based on the reconstruction error for each data point. If the error exceeds a threshold determined by the contamination value, it is identified as an anomaly.
To detect anomalies in time-series data, you can use:
- ARIMA_PLUS time series models: When you use
ML.DETECT_ANOMALIESwith an ARIMA_PLUS model, anomalies are identified based on the confidence interval for that timestamp. If the probability that the data point at that timestamp occurs outside of the prediction interval exceeds a probability threshold provided by the user, the datapoint is identified as an anomaly.
Below we show code examples of anomaly detection in BigQuery ML for each of the above scenarios.
Anomaly detection with a k-means clustering model
You can now detect anomalies using k-means clustering models, by running ML.DETECT_ANOMALIES to detect anomalies in the training data or in new input data. Begin by creating a k-means clustering model:
Language: SQL
CREATE MODEL `mydataset.my_kmeans_model`OPTIONS(MODEL_TYPE = 'kmeans',NUM_CLUSTERS = 8,KMEANS_INIT_METHOD = 'kmeans++') ASSELECT* EXCEPT(Time, Class)FROM`bigquery-public-data.ml_datasets.ulb_fraud_detection`;
With the k-means clustering model trained, you can now run ML.DETECT_ANOMALIES to detect anomalies in the training data or in new input data.
To detect anomalies in the training data, use ML.DETECT_ANOMALIES with the same data used during training:
Language: SQL
SELECT*FROMML.DETECT_ANOMALIES(MODEL `mydataset.my_kmeans_model`,STRUCT(0.02 AS contamination),TABLE `bigquery-public-data.ml_datasets.ulb_fraud_detection`);

To detect anomalies in new data, use ML.DETECT_ANOMALIES and provide new data as input:
Language: SQL
SELECT*FROMML.DETECT_ANOMALIES(MODEL `mydataset.my_kmeans_model`,STRUCT(0.02 AS contamination),(SELECT * FROM `mydataset.newdata`));

How does anomaly detection work for k-means clustering models?
Anomalies are identified based on the value of each input data point’s normalized distance to its nearest cluster, which, if exceeds a threshold determined by the contamination value, is identified as an anomaly. How does this work exactly? With a k-means model and data as inputs, ML.DETECT_ANOMALIES first computes the absolute distance for each input data point to all cluster centroids in the model, then normalizes each distance by the respective cluster radius (which is defined as the standard deviation of the absolute distances of all points in this cluster to the centroid). For each data point, ML.DETECT_ANOMALIES returns the nearest centroid_id based on normalized_distance, as seen in the screenshot above. The contamination value, specified by the user, determines the threshold of whether a data point is considered an anomaly. For example, a contamination value of 0.1 means that the top 10% of descending normalized distance from the training data will be used as the cut-off threshold. If the normalized distance for a datapoint exceeds the threshold, then it is identified as an anomaly. Setting an appropriate contamination will be highly dependent on the requirements of the user or business.
For more information on anomaly detection with k-means clustering, please see the documentation here.
Anomaly detection with an autoencoder model
You can now detect anomalies using autoencoder models, by running ML.DETECT_ANOMALIES to detect anomalies in the training data or in new input data.
Begin by creating an autoencoder model:
Language: SQL
CREATE MODEL `mydataset.my_autoencoder_model`OPTIONS(model_type='autoencoder',activation_fn='relu',batch_size=8,dropout=0.2,hidden_units=[32, 16, 4, 16, 32],learn_rate=0.001,l1_reg_activation=0.0001,max_iterations=10,optimizer='adam') ASSELECT* EXCEPT(Time, Class)FROM`bigquery-public-data.ml_datasets.ulb_fraud_detection`;
To detect anomalies in the training data, use ML.DETECT_ANOMALIES with the same data used during training:
Language: SQL
SELECT*FROMML.DETECT_ANOMALIES(MODEL `mydataset.my_autoencoder_model`,STRUCT(0.02 AS contamination),TABLE `bigquery-public-data.ml_datasets.ulb_fraud_detection`);

To detect anomalies in new data, use ML.DETECT_ANOMALIES and provide new data as input:
Language: SQL
SELECT*FROMML.DETECT_ANOMALIES(MODEL `mydataset.my_autoencoder_model`,STRUCT(0.02 AS contamination),(SELECT * FROM `mydataset.newdata`));

How does anomaly detection work for autoencoder models?
Anomalies are identified based on the value of each input data point’s reconstructed error, which, if exceeds a threshold determined by the contamination value, is identified as an anomaly. How does this work exactly? With an autoencoder model and data as inputs, ML.DETECT_ANOMALIES first computes the mean_squared_error for each data point between its original values and its reconstructed values. The contamination value, specified by the user, determines the threshold of whether a data point is considered an anomaly. For example, a contamination value of 0.1 means that the top 10% of descending error from the training data will be used as the cut-off threshold. Setting an appropriate contamination will be highly dependent on the requirements of the user or business.
For more information on anomaly detection with autoencoder models, please see the documentation here.
Anomaly detection with an ARIMA_PLUS time-series model

With ML.DETECT_ANOMALIES, you can now detect anomalies using ARIMA_PLUS time series models in the (historical) training data or in new input data. Here are some examples of when might you want to detect anomalies with time-series data:
Detecting anomalies in historical data:
- Cleaning up data for forecasting and modeling purposes, e.g. preprocessing historical time series before using them to train an ML model.
- When you have a large number of retail demand time series (thousands of products across hundreds of stores or zip codes), you may want to quickly identify which stores and product categories had anomalous sales patterns, and then perform a deeper analysis of why that was the case.
Forward looking anomaly detection:
- Detecting consumer behavior and pricing anomalies as early as possible: e.g. if traffic to a specific product page suddenly and unexpectedly spikes, it might be because of an error in the pricing process that leads to an unusually low price.
- When you have a large number of retail demand time series (thousands of products across hundreds of stores or zip codes), you would like to identify which stores and product categories had anomalous sales patterns based on your forecasts, so you can quickly respond to any unexpected spikes or dips.
How do you detect anomalies using ARIMA_PLUS? Begin by creating an ARIMA_PLUS time series model:
Language: SQL
CREATE OR REPLACE MODEL mydataset.my_arima_plus_modelOPTIONS(MODEL_TYPE='ARIMA_PLUS',TIME_SERIES_TIMESTAMP_COL='date',TIME_SERIES_DATA_COL='total_amount_sold',TIME_SERIES_ID_COL='item_name',HOLIDAY_REGION='US') ASSELECTdate,item_description AS item_name,SUM(bottles_sold) AS total_amount_soldFROM`bigquery-public-data.iowa_liquor_sales.sales`GROUP BYdate,item_nameHAVINGdate BETWEEN DATE('2016-01-04') AND DATE('2017-06-01')AND item_name IN ("Black Velvet", "Captain Morgan Spiced Rum","Hawkeye Vodka", "Five O'Clock Vodka", "Fireball Cinnamon Whiskey");
To detect anomalies in the training data, use ML.DETECT_ANOMALIES with the model obtained above:
Language: SQL
SELECT*FROMML.DETECT_ANOMALIES(MODEL `mydataset.my_arima_plus_model`,STRUCT(0.8 AS anomaly_prob_threshold));

To detect anomalies in new data, use ML.DETECT_ANOMALIES and provide new data as input:
Language: SQL
WITHnew_data AS (SELECTdate,item_description AS item_name,SUM(bottles_sold) AS total_amount_soldFROM`bigquery-public-data.iowa_liquor_sales.sales`GROUP BYdate,item_nameHAVINGdate BETWEEN DATE('2017-06-02')AND DATE('2017-10-01')AND item_name IN ('Black Velvet','Captain Morgan Spiced Rum','Hawkeye Vodka',"Five O'Clock Vodka",'Fireball Cinnamon Whiskey') )SELECT*FROMML.DETECT_ANOMALIES(MODEL `mydataset.my_arima_plus_model`,STRUCT(0.8 AS anomaly_prob_threshold),(SELECT*FROMnew_data));

For more information on anomaly detection with ARIMA_PLUS time series models, please see the documentation here.
Thanks to the BigQuery ML team, especially Abhinav Khushraj, Abhishek Kashyap, Amir Hormati, Jerry Ye, Xi Cheng, Skander Hannachi, Steve Walker, and Stephanie Wang.
Make Your Data Useful with Google Cloud Products and Services

3243
Of your peers have already read this article.
1:30 Minutes
The most insightful time you'll spend today!
While you likely know that data science is the practice of making data useful, you may not have a clear landscape around the tools that can aid each stage of the data science workflow as you use machine learning to tackle your challenges.
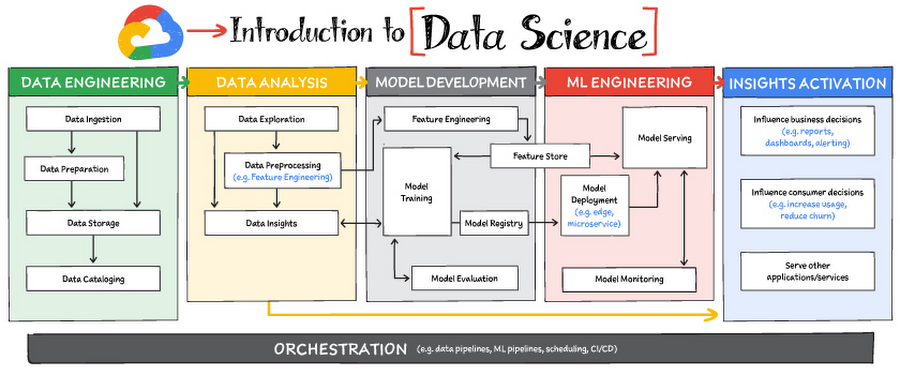
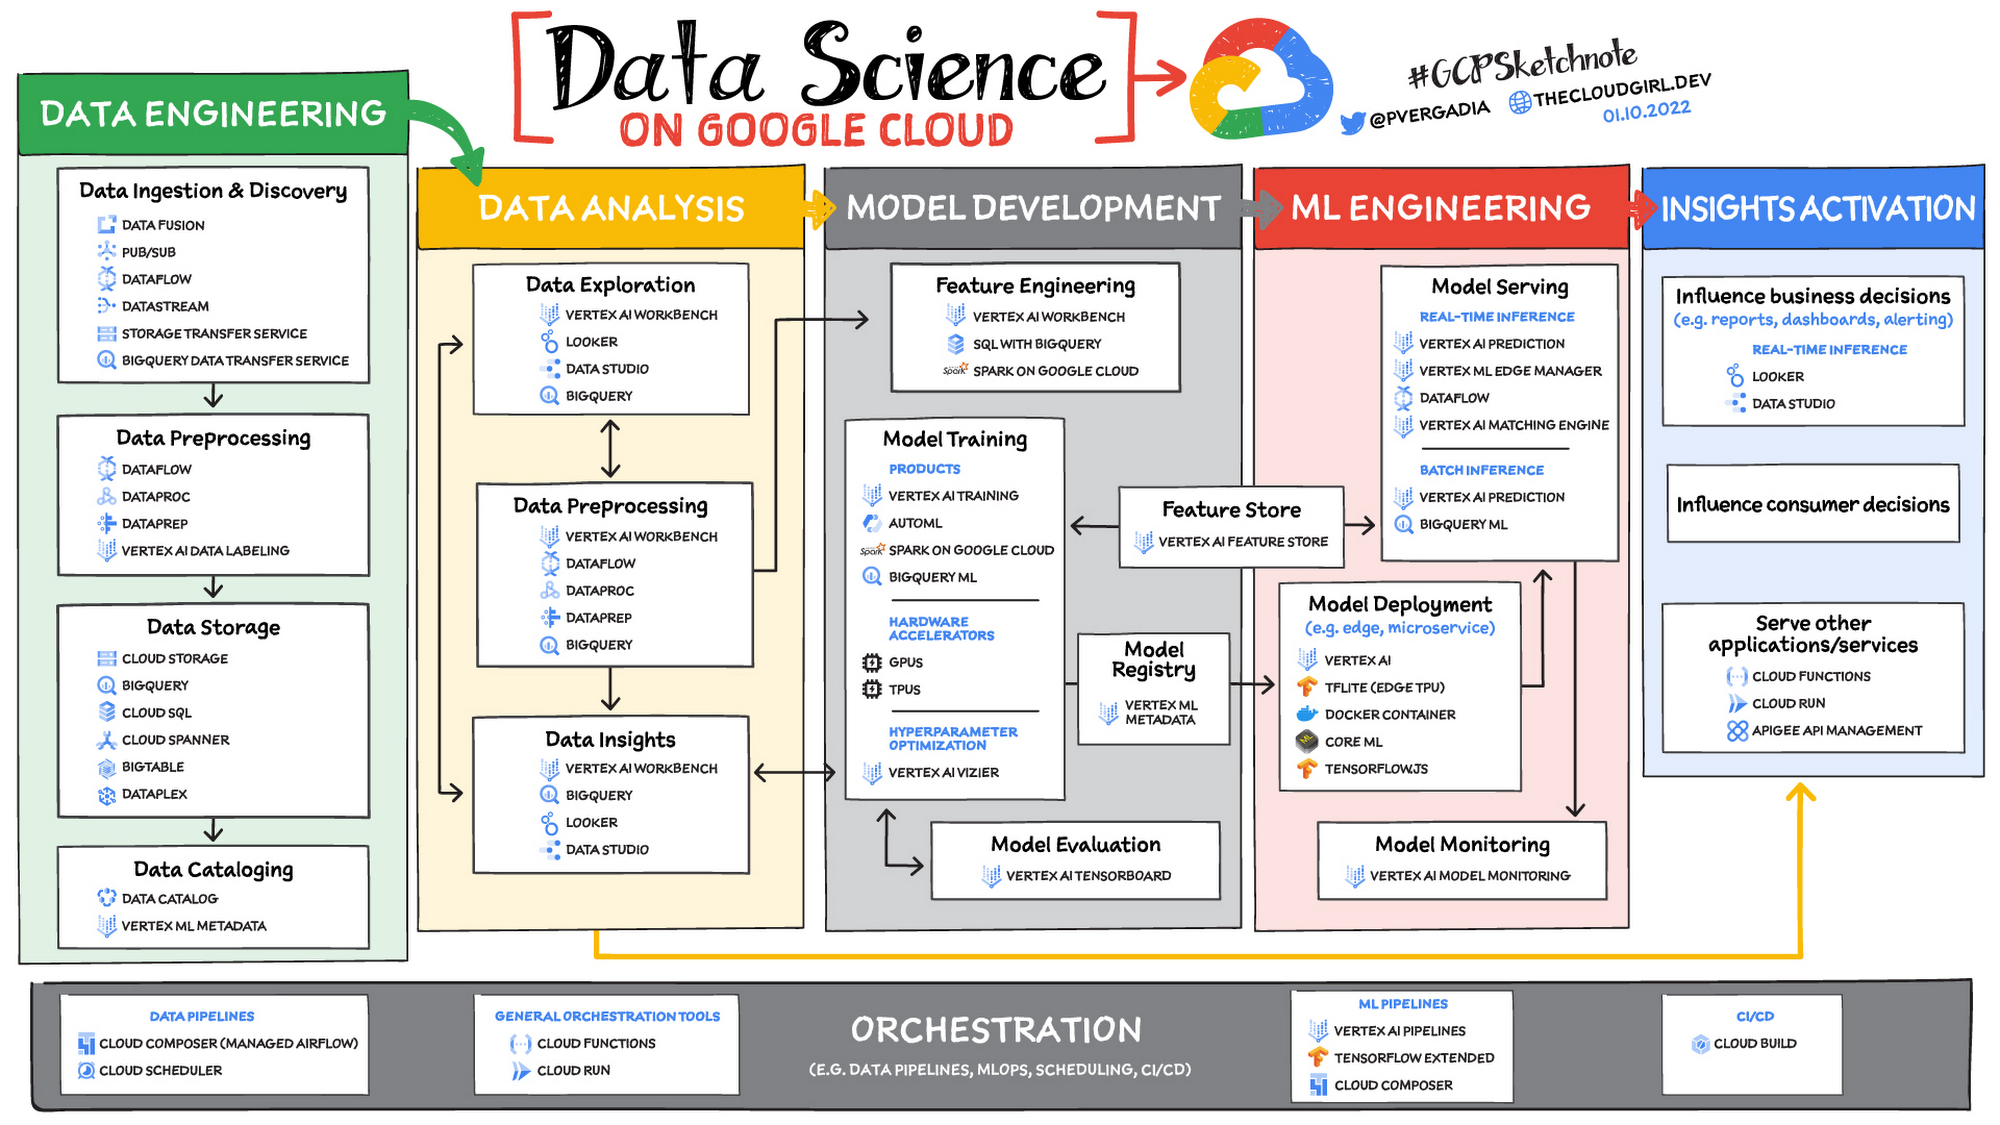
Read on to discover the six broad areas that are critical to the process of making data useful, and some corresponding Google Cloud products and services for those areas.
https://youtube.com/watch?v=EQvLUMjz-g4%3Fenablejsapi%3D1%26
Data engineering
Perhaps the greatest missed opportunities in data science stem from data that exists somewhere, but hasn’t been made accessible for use in further analysis. Laying the critical foundation for downstream systems, data engineering involves the transporting, shaping, and enriching of data for the purposes of making it available and accessible.
Data ingestion and data preprocessing on Google Cloud
Here we consider data ingestion as moving data from one place to another, and data preparation the process of transformation, augmentation, or enrichment prior to consumption. Global scalability, high throughput, real-time access, and robustness are common challenges in this stage. For scalable, real-time, and batch data processing, look into building data ingestion and preprocessing pipelines with Dataflow, a managed Apache Beam service. There’s a reason why Dataflow is called the backbone of analytics on Google Cloud.
If you’re looking for a scalable messaging system to help you ingest data, consider Cloud Pub/Sub, a global, horizontally scalable messaging infrastructure. Cloud Pub/Sub was built using the same infrastructure component that enabled Google products, including Ads, Search, and Gmail, to handle hundreds of millions of events per second.
If you want an easy way to automate data movement to BigQuery, a serverless data warehouse on Google Cloud, look into the BigQuery Data Transfer Service. For transferring data to Cloud Storage, take a look at the Storage Transfer Service. Or, for a no-code data ingestion and transformation tool, check out Data Fusion, which has over 150 preconfigured connectors and transformations. In addition to Dataflow and Data Fusion for data preparation, Spark users may want to look at related products and features for Spark on Google Cloud.
Data storage and data cataloging on Google Cloud
For structured data, consider a data warehouse like BigQuery, or any of the Cloud Databases (relational ones like Cloud SQL and NoSQL ones like Cloud BigTable and Cloud Firestore). For unstructured data, you can always use Cloud Storage. You may also want to consider a data lake. For data discovery, cataloging, and metadata management, consider Data Catalog. For a unified solution, take a look at Dataplex, which integrates a unified data management solution with an integrated analytics experience.
Learn more about data engineering on Google Cloud
- Explore the data engineering learning path
- Discover reference patterns
- Get certified by Google Cloud as a Professional Data Engineer
Data Analysis
From descriptive statistics to visualizations, data analysis is where the value of data starts to appear.
Data exploration, data preprocessing, and data insights
Data exploration, a highly iterative process, involves slicing and dicing data via data preprocessing before data insights can start to manifest through visualizations or simply via simple group-by, order-by operations. One hallmark of this phase is that the data scientist may not yet know which questions to ask about the data. In this somewhat ephemeral phase, a data analyst or scientist has likely uncovered some aha-moments, but hasn’t shared them yet. Once insights are shared, the flow enters the Insights Activation stage, where those insights become used to guide business decisions, influence consumer choices, or become embedded in other applications or services.
On Google Cloud, there are many ways to explore, preprocess, and uncover insights in your data. If you are looking for a notebook-based end-to-end data science environment, check out Vertex AI Workbench, which enables you to access, analyze, and visualize your entire data estate: from structured data at the petabyte-scale in SQL with BigQuery, to processing data with Spark on Google Cloud and its serverless, auto-scaling, and GPU acceleration capabilities. As a unified data science environment, Vertex AI Workbench also makes it easy to do machine learning with TensorFlow, PyTorch, and Spark, with built-in MLOps capabilities.
Finally, if your focus is on analyzing structured data from data warehouses and insight activation for business intelligence, you may want to also consider using Looker, with its rich interactive analytics, visualizations, dashboarding tools, and Looker Blocks to help you accelerate your time-to-insight.
Learn more about data analysis on Google Cloud
- Learn about Vertex AI Workbench for a Jupyter-based fully managed notebook environment
- Learn about how you can use BigQuery for petabyte-scale data analysis
- Learn about Spark on Google Cloud
- Discover the data analyst learning path
- Explore reference patterns for common analytics use cases
Model development
From linear regression to XGBoost, from TensorFlow to PyTorch, the model development stage is where machine learning starts to provide new ways of unlocking value from your data. Experimentation is a strong theme here, with data scientists looking to accelerate iteration speed between models without worrying about infrastructure overhead or context-switching between tools for data analysis and tools for productionizing models with MLOps.
To solve these challenges, once again, as a Jupyter-based fully managed, scalable, and enterprise-ready environment, Vertex AI Workbench makes it easy as the one-stop-shop for data science, combining analytics and machine learning, including Vertex AI services. Apache Spark, XGBoost, TensorFlow, and PyTorch are just some of the frameworks supported on Vertex AI Workbench. Vertex AI Workbench makes managing the underlying compute infrastructure needed for model training easy with the ability to scale vertically and horizontally, and with idle timeouts and auto shutdown capabilities to reduce unnecessary costs. Notebooks themselves can be used for distributed training and hyperparameter optimization, and they include Git integration for version control. Due to the significant reduction in context switching required, data scientists can build and train models 5x faster using Vertex AI Workbench than when using traditional notebooks.
With Vertex AI, custom models can be trained and deployed using containers. You can take advantage of pre-built containers or custom containers to train and deploy your models.
For low-code model development, data analysts and data scientists can use SQL with BigQuery ML to train and deploy models (including XGBoost, deep neural networks, and PCA), directly using BigQuery’s built-in serverless, autoscaling capabilities. Behind-the-scenes, BigQuery ML leverages Vertex AI to enable automated hyperparameter tuning, and explainable AI. For no-code model development, Vertex AI Training provides a point-and-click interface to train powerful models using AutoML, which comes in multiple flavors: AutoML Tables, AutoML Image, AutoML Text, AutoML Video, and AutoML Translation.
Learn more about model development on Google Cloud
- Learn about Vertex AI Workbench for a Jupyter-based fully managed notebook environment
- Learn more about Vertex AI
ML engineering
Once a satisfactory model is developed, the next step is to incorporate all the activities of a well-engineered application lifecycle, including testing, deployment, and monitoring. And all of those activities should be as automated and robust as possible.
Managed datasets and Feature Store on Vertex AI provide shared repositories for datasets and engineered features, respectively, which provide a single source of truth for data and promote reuse and collaboration within and across teams. Vertex AI’s model serving capability enables deployment of models with multiple versions, automatic capacity scaling, and user-specified load balancing. Finally, Vertex AI Model Monitoring provides the ability to monitor prediction requests flowing into a deployed model and automatically alert model owners whenever the production traffic deviates beyond user-defined thresholds and previous historical prediction requests.
MLOps is the industry term for modern, well engineered ML services, with scalability, monitoring, reliability, automated CI/CD, and many other characteristics and functions that are now taken for granted in the application domain. The ML engineering features provided by Vertex AI are informed by Google’s extensive experience deploying and operating internal ML services. Our goal with Vertex AI is to provide everyone with easy access to essential MLOps services and best practices.
Learn more about ML engineering and MLOps on Google Cloud
- Follow the guides, tutorials and documentation for Vertex AI
- Watch this video to learn more about Vertex AI
- Discover the data scientist/machine learning engineer learning path
- Get certified as a Professional ML Engineer
Insights activation
The insights activation stage is where your data has now become useful to other teams and processes. You can use Looker and Data Studio to enable use cases in which data is used to influence business decisions with charts, reports, and alerts.
Data can also influence customer decisions and as a result increase usage or decrease churn, for example. Finally, the data can also be used by other services to drive insights; these services can run outside Google Cloud, inside Google Cloud on Cloud Run or Cloud Functions, and/or using Apigee API Management as an interface.
Learn more about insights activation on Google Cloud
- Watch this video to learn about building interactive ML apps using Looker and Vertex AI
- Learn about Looker, and Looker solutions for eCommerce, Digital Media and more
- Discover a gallery of interactive dashboards created with Data Studio
- Watch this video to understand the difference between Cloud Run and Cloud Functions
Orchestration
All of the capabilities discussed above provide the key building blocks to a modern data science solution, but a practical application of those capabilities requires orchestration to automatically manage the flow of data from one service to another. This is where a combination of data pipelines, ML pipelines, and MLOps comes into play. Effective orchestration reduces the amount of time that it takes to reliably go from data ingestion to deploying your model in production, in a way that lets you monitor and understand your ML system.
For data pipeline orchestration, Cloud Composer and Cloud Scheduler are both used to kick off and maintain the pipeline.
For ML pipeline orchestration, Vertex AI Pipelines is a managed machine learning service that enables you to increase the pace at which you experiment with and develop machine learning models and the pace at which you transition those models to production. Vertex Pipelines is serverless, which means that you don’t need to deal with managing an underlying GKE cluster or infrastructure. It scales up when you need it to, and you pay only for what you use. In short, it lets you just focus on building your data science pipelines.
Learn more about orchestration on Google Cloud
- Read more about Cloud Composer for Airflow-based pipelines
- Try some example notebooks on Github with Vertex AI Pipelines
- Learn different ways to trigger Vertex AI Pipeline runs
- Read the whitepaper on Practitioners Guide to MLOps: A framework for continuous delivery and automation of machine learning
Summary
Google Cloud offers a complete suite of data management, analytics, and machine learning tools to generate insights from data. Want to learn more? Check out the following resources:
Special thanks to the following contributors to this blogpost: Alok Pattani, Brad Miro, Saeed Aghabozorgi, Diptiman Raichaudhuri, Reza Rokni.
Medical Data Breakthrough: Google Aids PicnicHealth’s Growth

4902
Of your peers have already read this article.
3:30 Minutes
The most insightful time you'll spend today!
In the fragmented world of U.S. healthcare, patients often have to wait in line or on hold, navigate multiple patient portals, and fill out numerous request forms—all in pursuit of their own medical history. Healthcare technology startup PicnicHealth is on a mission to put control back with the patient, where it belongs.
PicnicHealth’s growth, from closing successful venture rounds to winning machine learning (ML) competitions, speaks to not only improvements and opportunities in healthcare, but also how startups are leveraging Google Workspace and Google Cloud services to accelerate momentum.
The company does the heavy lifting of collecting records and leverages human-in-the-loop ML to transcribe and validate them with an abstraction team of medical professionals. The records are then structured into a complete medical history that patients can access and share with providers to get better care.
But PicnicHealth helps to improve patient health on more than one front. It allows patients to contribute their data to de-identified medical research, building high-quality, anonymized datasets that researchers and life sciences companies can use to better understand disease progression and treatment in the real world.
Google Workspace has been part of PicnicHealth from day one, helping the founders collaborate and shape the company’s vision using cloud-synced documents and spreadsheets to collaborate and model predictions. “I’ve had a Gmail account since 2006, and in college 100% of people worked out of Google Docs. Workspace continues to be the best choice for online collaboration, and that’s why it’s still the default standard for startups,” said Troy Astorino, CoFounder & CTO of PicnicHealth. “When we started PicnicHealth, my co-founder Noga Leviner was in San Francisco and I was in Southern California, and of course we used Workspace.”
Today, Google Workspace continues to play a central role in the company’s collaboration. “We create design documents in Google Docs, primarily for engineering and product changes, and get really healthy, vibrant discussions through comments,” noted Astorino. “This practice has grown beyond engineering and is used for everything from how the company operates to communication norms.”
Google Workspace offers everything the team needs to collaborate, no matter where employees are. PicnicHealth’s team has spread from San Francisco to being distributed across the country and around the world. Instant collaboration is crucial.
“We work in a complex domain where people need a lot of information to make good decisions,” said Astorino. “Google Workspace allows us to operate in a mode of default transparency, where people can easily get the information they need even if it wasn’t intentionally or directly shared with them. Whether it’s working in Docs or scheduling in Calendar, we can operate much more effectively than we could otherwise.”
By any measure, PicnicHealth’s trajectory is one of record success. The startup is a 2014 alumni of Y Combinator, a program that helped launch household names like Airbnb, DoorDash, and Dropbox. Three years later, the team went on to win the $1 million grand prize at Google’s Machine Learning Competition. And the momentum has continued— PicnicHealth has recently announced a $60 million Series C round, bringing the amount raised to date to over $100 million. With the Series C, PicnicHealth is investing in expanding its reach to more patients across over 30 diseases.
As a healthcare startup, PicnicHealth faced a very particular set of challenges, especially when working with and accessing data. Data fragmentation and interoperability are only some of the challenges of realizing the value of big data in the cloud. The healthcare industry is notoriously difficult to navigate due to sensitive data protection laws and regulations like the Health Insurance Portability and Accountability Act (HIPAA).
PicnicHealth started in the cloud on Amazon Web Services (AWS). However, after migrating over to Kubernetes and facing an expanding list of requirements for HIPAA compliance, the company started to explore alternatives.
“We needed to be HIPAA compliant, which was going to be painful on AWS, and we wanted to get away from managing and operating our own Kubernetes clusters,” recalled Astorino. “We had heard good things about GKE (Google Kubernetes Engine). And particularly valuable for us, — many technical requirements you need for HIPAA compliance are configured by default on Google Cloud.”
PicnicHealth would have had to implement a lot of changes and get specialized instance types to get their existing configuration to work. So, they began experimenting with Google Cloud and discovered a much smoother experience.
“It was a lot easier to manage in terms of product setup and developer experience,” said Astorino. “There is a sane product hierarchy of resources you can access and use through Google Cloud and the relationships between them, from coordinated IAM (identity and access management) to using Google Groups for granting permissions. Overall, it’s cleaner.”
Astorino added that the move has also opened the doors to taking advantage of other services in the Google Cloud ecosystem like Cloud SQL, BigQuery, and Cloud Composer. PicnicHealth also uses Security Command Center because it easily integrates with everything but also helps meet various compliance frameworks’ requirements, providing visibility, near-real-time asset discovery, and security information and event management.
But most importantly, the integrated ecosystem has simplified the work needed for PicnicHealth to create a secure environment for employees to use when working with sensitive medical records while still providing all the tools they need. For example, abstractors not only use Google Workspace but also have Chromebooks because they are easy to manage and secure.
Altogether, Google Cloud helps form a technology stack that has enabled the startup to build a massive labeled dataset containing over 100 million labeled medical data concepts. In turn, it accelerates PicnicHealth’s ability to generate highly-performant AI models and feed other ML pipelines, which has been vital for processing and reviewing data at scale.
To learn more about how Google Workspace and Google Cloud help startups like PicnicHealth accelerate their journey, visit our startups solutions pages for Google Workspace and Google Cloud.
More Relevant Stories for Your Company

Learn to Deploy Custom Models on Vertex AI
In May we announced Vertex AI, our new unified AI platform which provides options for everything from using pre-trained models to building your models with a variety of frameworks. In this post we'll do a deep dive on training and deploying a custom model on Vertex AI. There are many

Incorporating Custom Holidays into Your Time-Series Models with BigQuery ML
About three years ago, JCB, one of the biggest Japanese payment companies, launched a project to develop new high-value services with agility. We set up a policy of starting small from scratch without using the existing system, which we call the concept of “Dejima”, where we focused on improving various aspects

Contact Center AI Platform Brings Together the Merits of AI, Cloud Scalability, CRM Integration and Multi-experiences!
Providing best-in-class customer service is crucial for the success of your business. Contact centers are a critical touch point, as they have to balance between representing your brand and prioritizing customer care. When your customers seek help and support, they expect efficient service that is accessible through modern voice and

ShareChat Builds its Diverse, Hyperlocal Social Network. Thanks to Google Cloud
Editor’s note: Today’s guest post comes from Indian social media platform ShareChat. Here’s the story of how they improved performance, app development, and analytics for serving regional content to millions of users using Google Cloud. How do you create a social network when your country has 22 major official languages and
