





Medical Data Breakthrough: Google Aids PicnicHealth’s Growth

4883
Of your peers have already read this article.
3:30 Minutes
The most insightful time you'll spend today!
In the fragmented world of U.S. healthcare, patients often have to wait in line or on hold, navigate multiple patient portals, and fill out numerous request forms—all in pursuit of their own medical history. Healthcare technology startup PicnicHealth is on a mission to put control back with the patient, where it belongs.
PicnicHealth’s growth, from closing successful venture rounds to winning machine learning (ML) competitions, speaks to not only improvements and opportunities in healthcare, but also how startups are leveraging Google Workspace and Google Cloud services to accelerate momentum.
The company does the heavy lifting of collecting records and leverages human-in-the-loop ML to transcribe and validate them with an abstraction team of medical professionals. The records are then structured into a complete medical history that patients can access and share with providers to get better care.
But PicnicHealth helps to improve patient health on more than one front. It allows patients to contribute their data to de-identified medical research, building high-quality, anonymized datasets that researchers and life sciences companies can use to better understand disease progression and treatment in the real world.
Google Workspace has been part of PicnicHealth from day one, helping the founders collaborate and shape the company’s vision using cloud-synced documents and spreadsheets to collaborate and model predictions. “I’ve had a Gmail account since 2006, and in college 100% of people worked out of Google Docs. Workspace continues to be the best choice for online collaboration, and that’s why it’s still the default standard for startups,” said Troy Astorino, CoFounder & CTO of PicnicHealth. “When we started PicnicHealth, my co-founder Noga Leviner was in San Francisco and I was in Southern California, and of course we used Workspace.”
Today, Google Workspace continues to play a central role in the company’s collaboration. “We create design documents in Google Docs, primarily for engineering and product changes, and get really healthy, vibrant discussions through comments,” noted Astorino. “This practice has grown beyond engineering and is used for everything from how the company operates to communication norms.”
Google Workspace offers everything the team needs to collaborate, no matter where employees are. PicnicHealth’s team has spread from San Francisco to being distributed across the country and around the world. Instant collaboration is crucial.
“We work in a complex domain where people need a lot of information to make good decisions,” said Astorino. “Google Workspace allows us to operate in a mode of default transparency, where people can easily get the information they need even if it wasn’t intentionally or directly shared with them. Whether it’s working in Docs or scheduling in Calendar, we can operate much more effectively than we could otherwise.”
By any measure, PicnicHealth’s trajectory is one of record success. The startup is a 2014 alumni of Y Combinator, a program that helped launch household names like Airbnb, DoorDash, and Dropbox. Three years later, the team went on to win the $1 million grand prize at Google’s Machine Learning Competition. And the momentum has continued— PicnicHealth has recently announced a $60 million Series C round, bringing the amount raised to date to over $100 million. With the Series C, PicnicHealth is investing in expanding its reach to more patients across over 30 diseases.
As a healthcare startup, PicnicHealth faced a very particular set of challenges, especially when working with and accessing data. Data fragmentation and interoperability are only some of the challenges of realizing the value of big data in the cloud. The healthcare industry is notoriously difficult to navigate due to sensitive data protection laws and regulations like the Health Insurance Portability and Accountability Act (HIPAA).
PicnicHealth started in the cloud on Amazon Web Services (AWS). However, after migrating over to Kubernetes and facing an expanding list of requirements for HIPAA compliance, the company started to explore alternatives.
“We needed to be HIPAA compliant, which was going to be painful on AWS, and we wanted to get away from managing and operating our own Kubernetes clusters,” recalled Astorino. “We had heard good things about GKE (Google Kubernetes Engine). And particularly valuable for us, — many technical requirements you need for HIPAA compliance are configured by default on Google Cloud.”
PicnicHealth would have had to implement a lot of changes and get specialized instance types to get their existing configuration to work. So, they began experimenting with Google Cloud and discovered a much smoother experience.
“It was a lot easier to manage in terms of product setup and developer experience,” said Astorino. “There is a sane product hierarchy of resources you can access and use through Google Cloud and the relationships between them, from coordinated IAM (identity and access management) to using Google Groups for granting permissions. Overall, it’s cleaner.”
Astorino added that the move has also opened the doors to taking advantage of other services in the Google Cloud ecosystem like Cloud SQL, BigQuery, and Cloud Composer. PicnicHealth also uses Security Command Center because it easily integrates with everything but also helps meet various compliance frameworks’ requirements, providing visibility, near-real-time asset discovery, and security information and event management.
But most importantly, the integrated ecosystem has simplified the work needed for PicnicHealth to create a secure environment for employees to use when working with sensitive medical records while still providing all the tools they need. For example, abstractors not only use Google Workspace but also have Chromebooks because they are easy to manage and secure.
Altogether, Google Cloud helps form a technology stack that has enabled the startup to build a massive labeled dataset containing over 100 million labeled medical data concepts. In turn, it accelerates PicnicHealth’s ability to generate highly-performant AI models and feed other ML pipelines, which has been vital for processing and reviewing data at scale.
To learn more about how Google Workspace and Google Cloud help startups like PicnicHealth accelerate their journey, visit our startups solutions pages for Google Workspace and Google Cloud.
Dataplex: Google Cloud’s Intelligent Data Fabric to Manage Data and Analytics at Scale

4856
Of your peers have already read this article.
2:30 Minutes
The most insightful time you'll spend today!
Enterprises are struggling to make high quality data easily discoverable and accessible for analytics, across multiple silos, to a growing number of people and tools within their organization. They are often forced to make tradeoffs—to move and duplicate data across silos to enable diverse analytics use cases or leave their data distributed but limit the agility of decisions.
Today we are excited to announce Dataplex, an intelligent data fabric that provides a way to centrally manage, monitor, and govern your data across data lakes, data warehouses and data marts, and make this data securely accessible to a variety of analytics and data science tools.
Dataplex provides an integrated analytics experience, bringing together the best of Google Cloud and open source tools, so you can rapidly curate, secure, integrate, and analyze data at scale. With built-in data intelligence using Google Artificial Intelligence (AI) and machine learning (ML) capabilities and a flexible consumption model, you can now spend less time wrestling with infrastructure and more time focused on driving business outcomes.
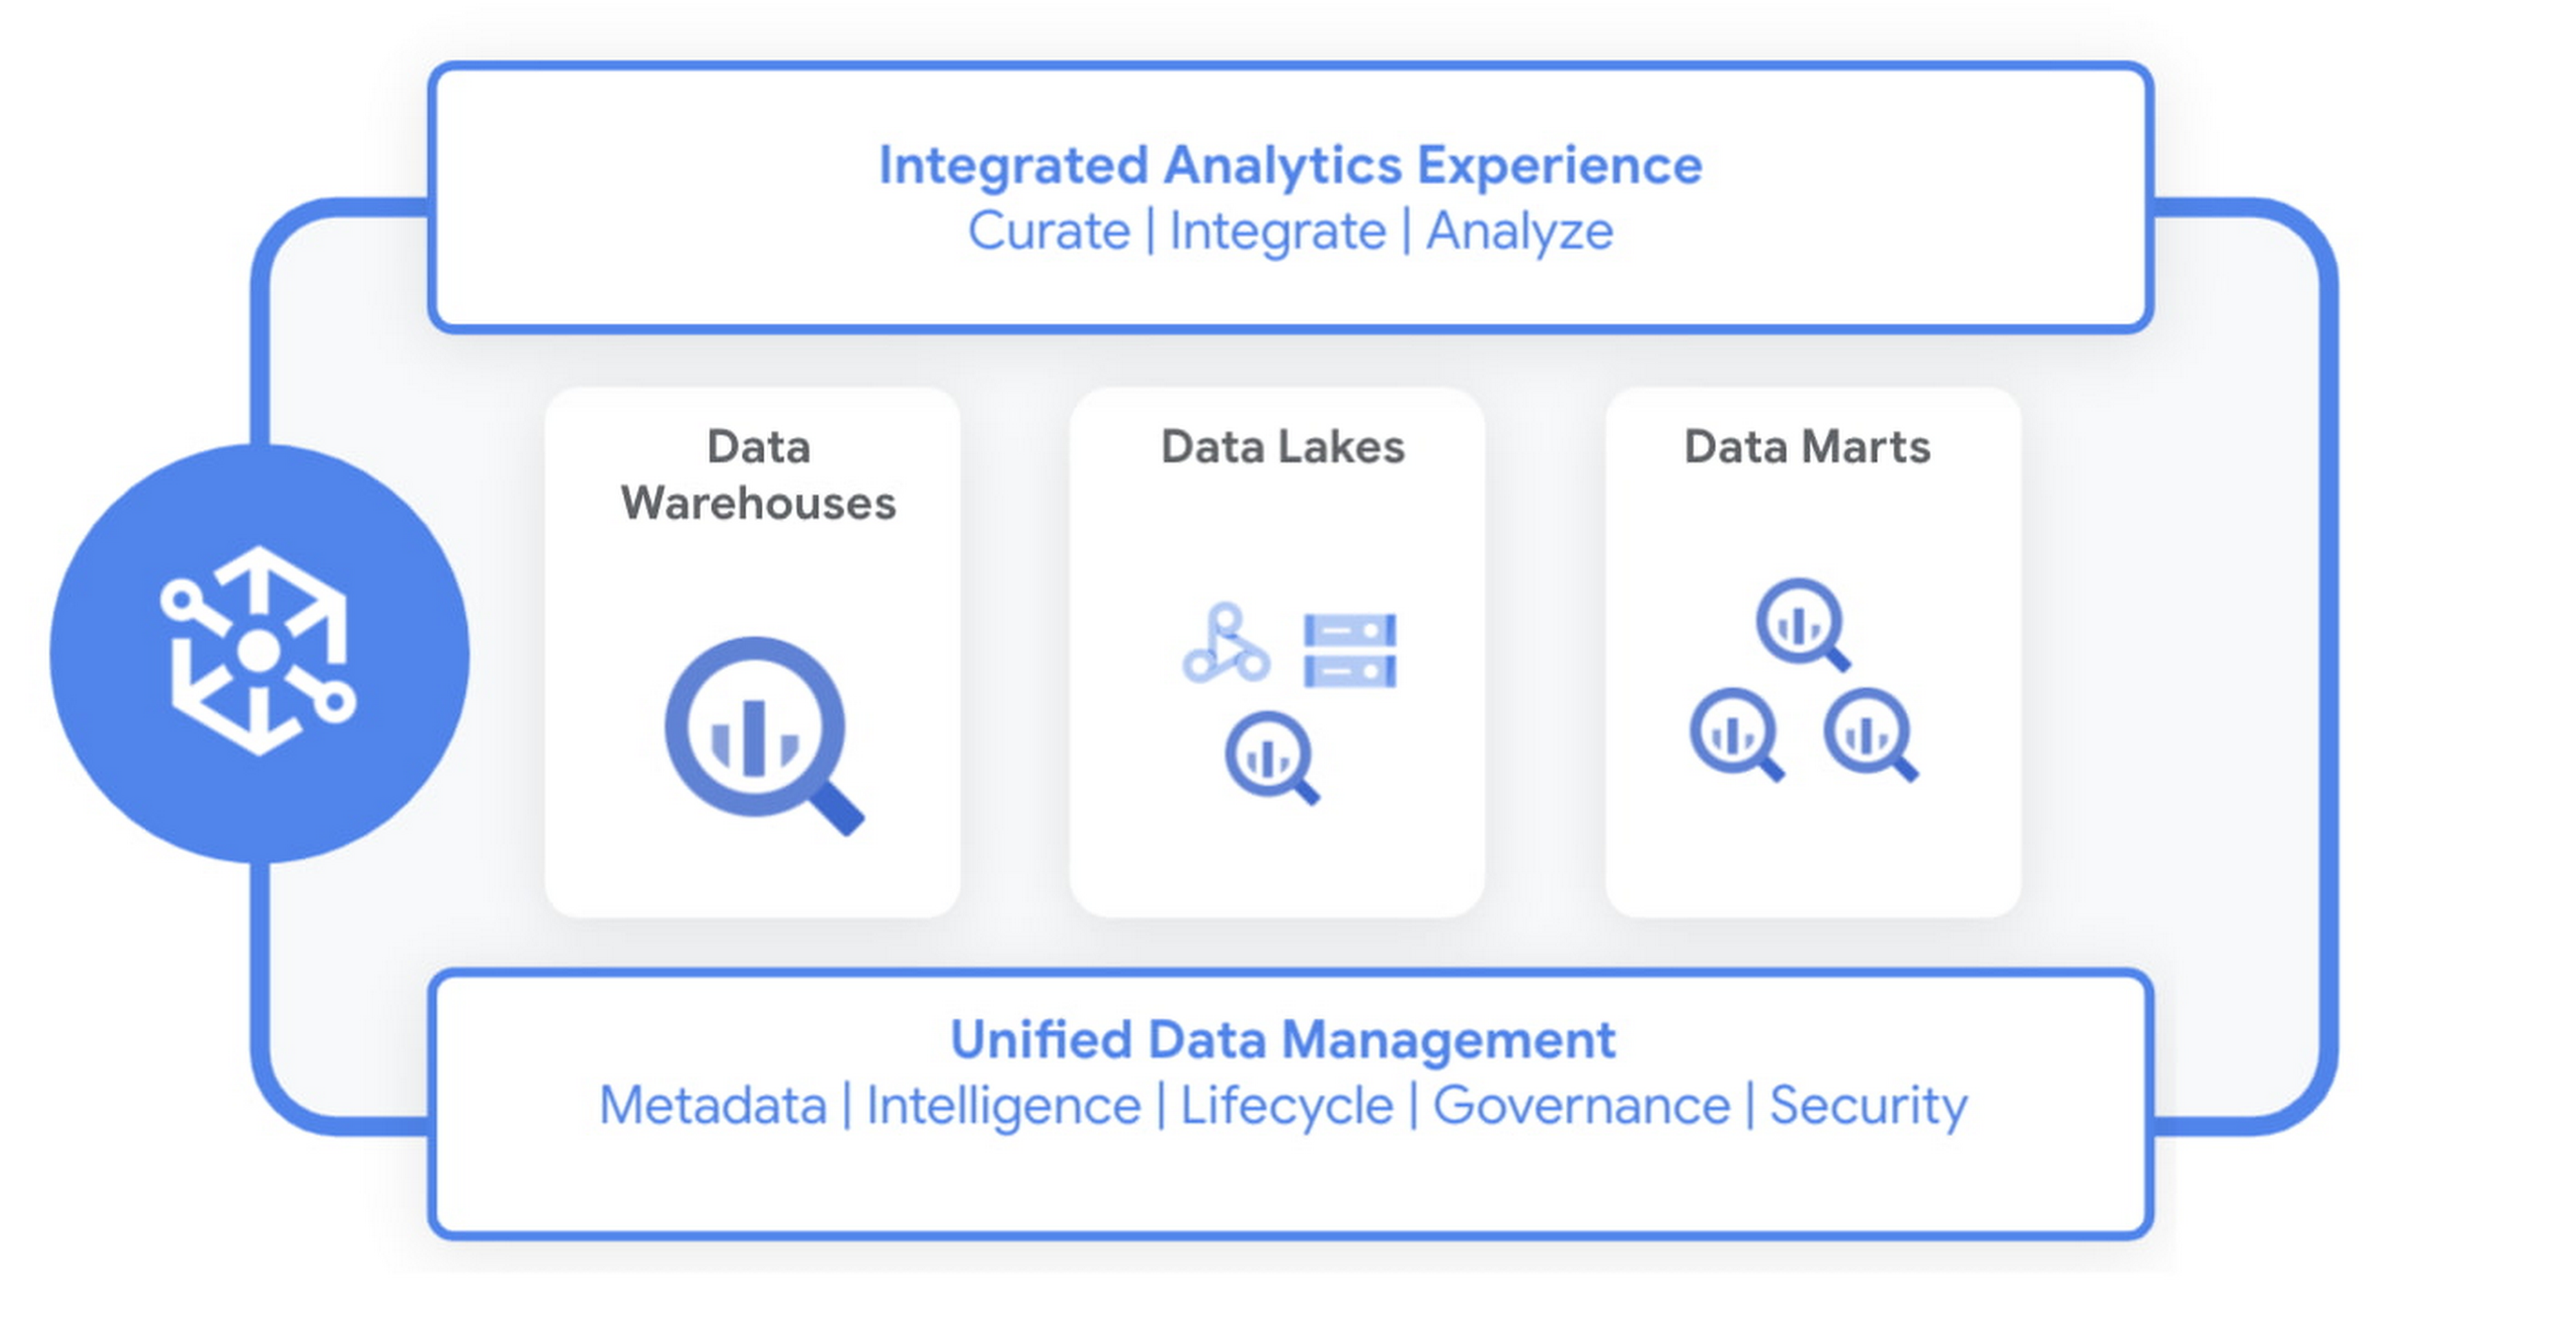
Dataplex enables you to:
- Achieve freedom of choice to store data wherever you want for the right price/performance and choose the best analytics tools for the job, including Google Cloud and open source analytics technologies such as Apache Spark and Presto.
- Enforce consistent controls across your data to ensure unified security and governance
- Take advantage of the built-in data intelligence using Google’s best in class AI/ML capabilities to automate much of the manual toil around data management and get access to higher quality data.
Early customers like Equifax, Loblaw, and ANZ are excited about using Dataplex to address data management complexity.
“Dataplex will greatly simplify the existing analytics workflows within Equifax with its unified data fabric and single interface for policy management and governance across all our analytics data. Its built-in data discovery and data quality features will ensure that our data scientists and analysts always have access to high quality data that they can trust. Dataplex aligns well with our enterprise data strategy and we are excited to partner with Google Cloud on this.”
—Kumar Menon, SVP, Data Fabric & Decision Science Technology, Equifax.
“Loblaw is Canada’s food and pharmacy leader, and we are excited to be an early adopter of Dataplex. We could significantly benefit from Dataplex as it provides a single pane of glass for end-to-end data management and governance. We are particularly interested in improving platform resilience and data quality by detecting anomalies as early as possible in the data pipeline with the help of Dataplex.”
—Elton Martins, Senior Director of Data Insights & Analytics, Loblaw
“We are undergoing a major data transformation at ANZ, bringing together our various data assets and building a cohesive data ecosystem for customer benefit. Dataplex’s vision and capabilities align well with our current data strategy to build a unified data fabric for all our analytics and AI/ML use cases. We are excited to partner with GCP on Dataplex and test the product in private preview.”
—Ashish Shekhar, Head of Technology – Enterprise Analytics & Applied AI, ANZ
Dataplex is built for distributed data. We are starting with data stored in Google Cloud Storage and BigQuery, with support for other data sources coming soon. It provides a workflow-driven experience helping you build an open data platform and make data easily accessible to your end users while ensuring your policies and best practices are consistently enforced.
Organizing and curating your data
One of the core tenets of Dataplex is letting you organize and manage your data in a way that makes sense for your business, without data movement or duplication. For that, we are providing logical constructs like lakes, data zones and assets. Those constructs enable you to abstract away the underlying storage systems and become the foundation for setting policies around data access, security, lifecycle management, and so on.
For example, you can create a lake per department within your organization (Retail, Sales, Finance, etc.) and create data zones that map to data readiness and usage (landing, raw, curated_data_analytics, curated_data_science, etc.).
Once you have your lakes and zones setup, you can now attach data to these zones as assets. You can add data from different types of storage (e.g. GCS Bucket and BigQuery dataset) under the same zone. You can also attach data across multiple projects under the same zone.

You can ingest data into your lakes and zones using the tools of your choice including services such as Dataflow, Data Fusion, Dataproc, Pub/Sub or choose from one of our partner products. Dataplex provides built-in 1-click templates for common data management tasks.
Securing your data
Dataplex enables you to define and enforce consistent policies across your data, irrespective of where it physically resides. Data owners can easily set up policies for specific data domains based on business needs, without thinking about where the data is stored while data stewards get global visibility into governance policies and permissions across their data.
You can apply security and governance policies for your entire lake, a specific zone, or an asset. Dataplex maps the policies to the underlying storage and pushes down permissions to the storage layer to provide end-to-end secure data access. Additionally, you can secure not just data but also related artifacts like notebooks, scripts, and models using the same set of access policies.
Making high quality data available for analytics and data science
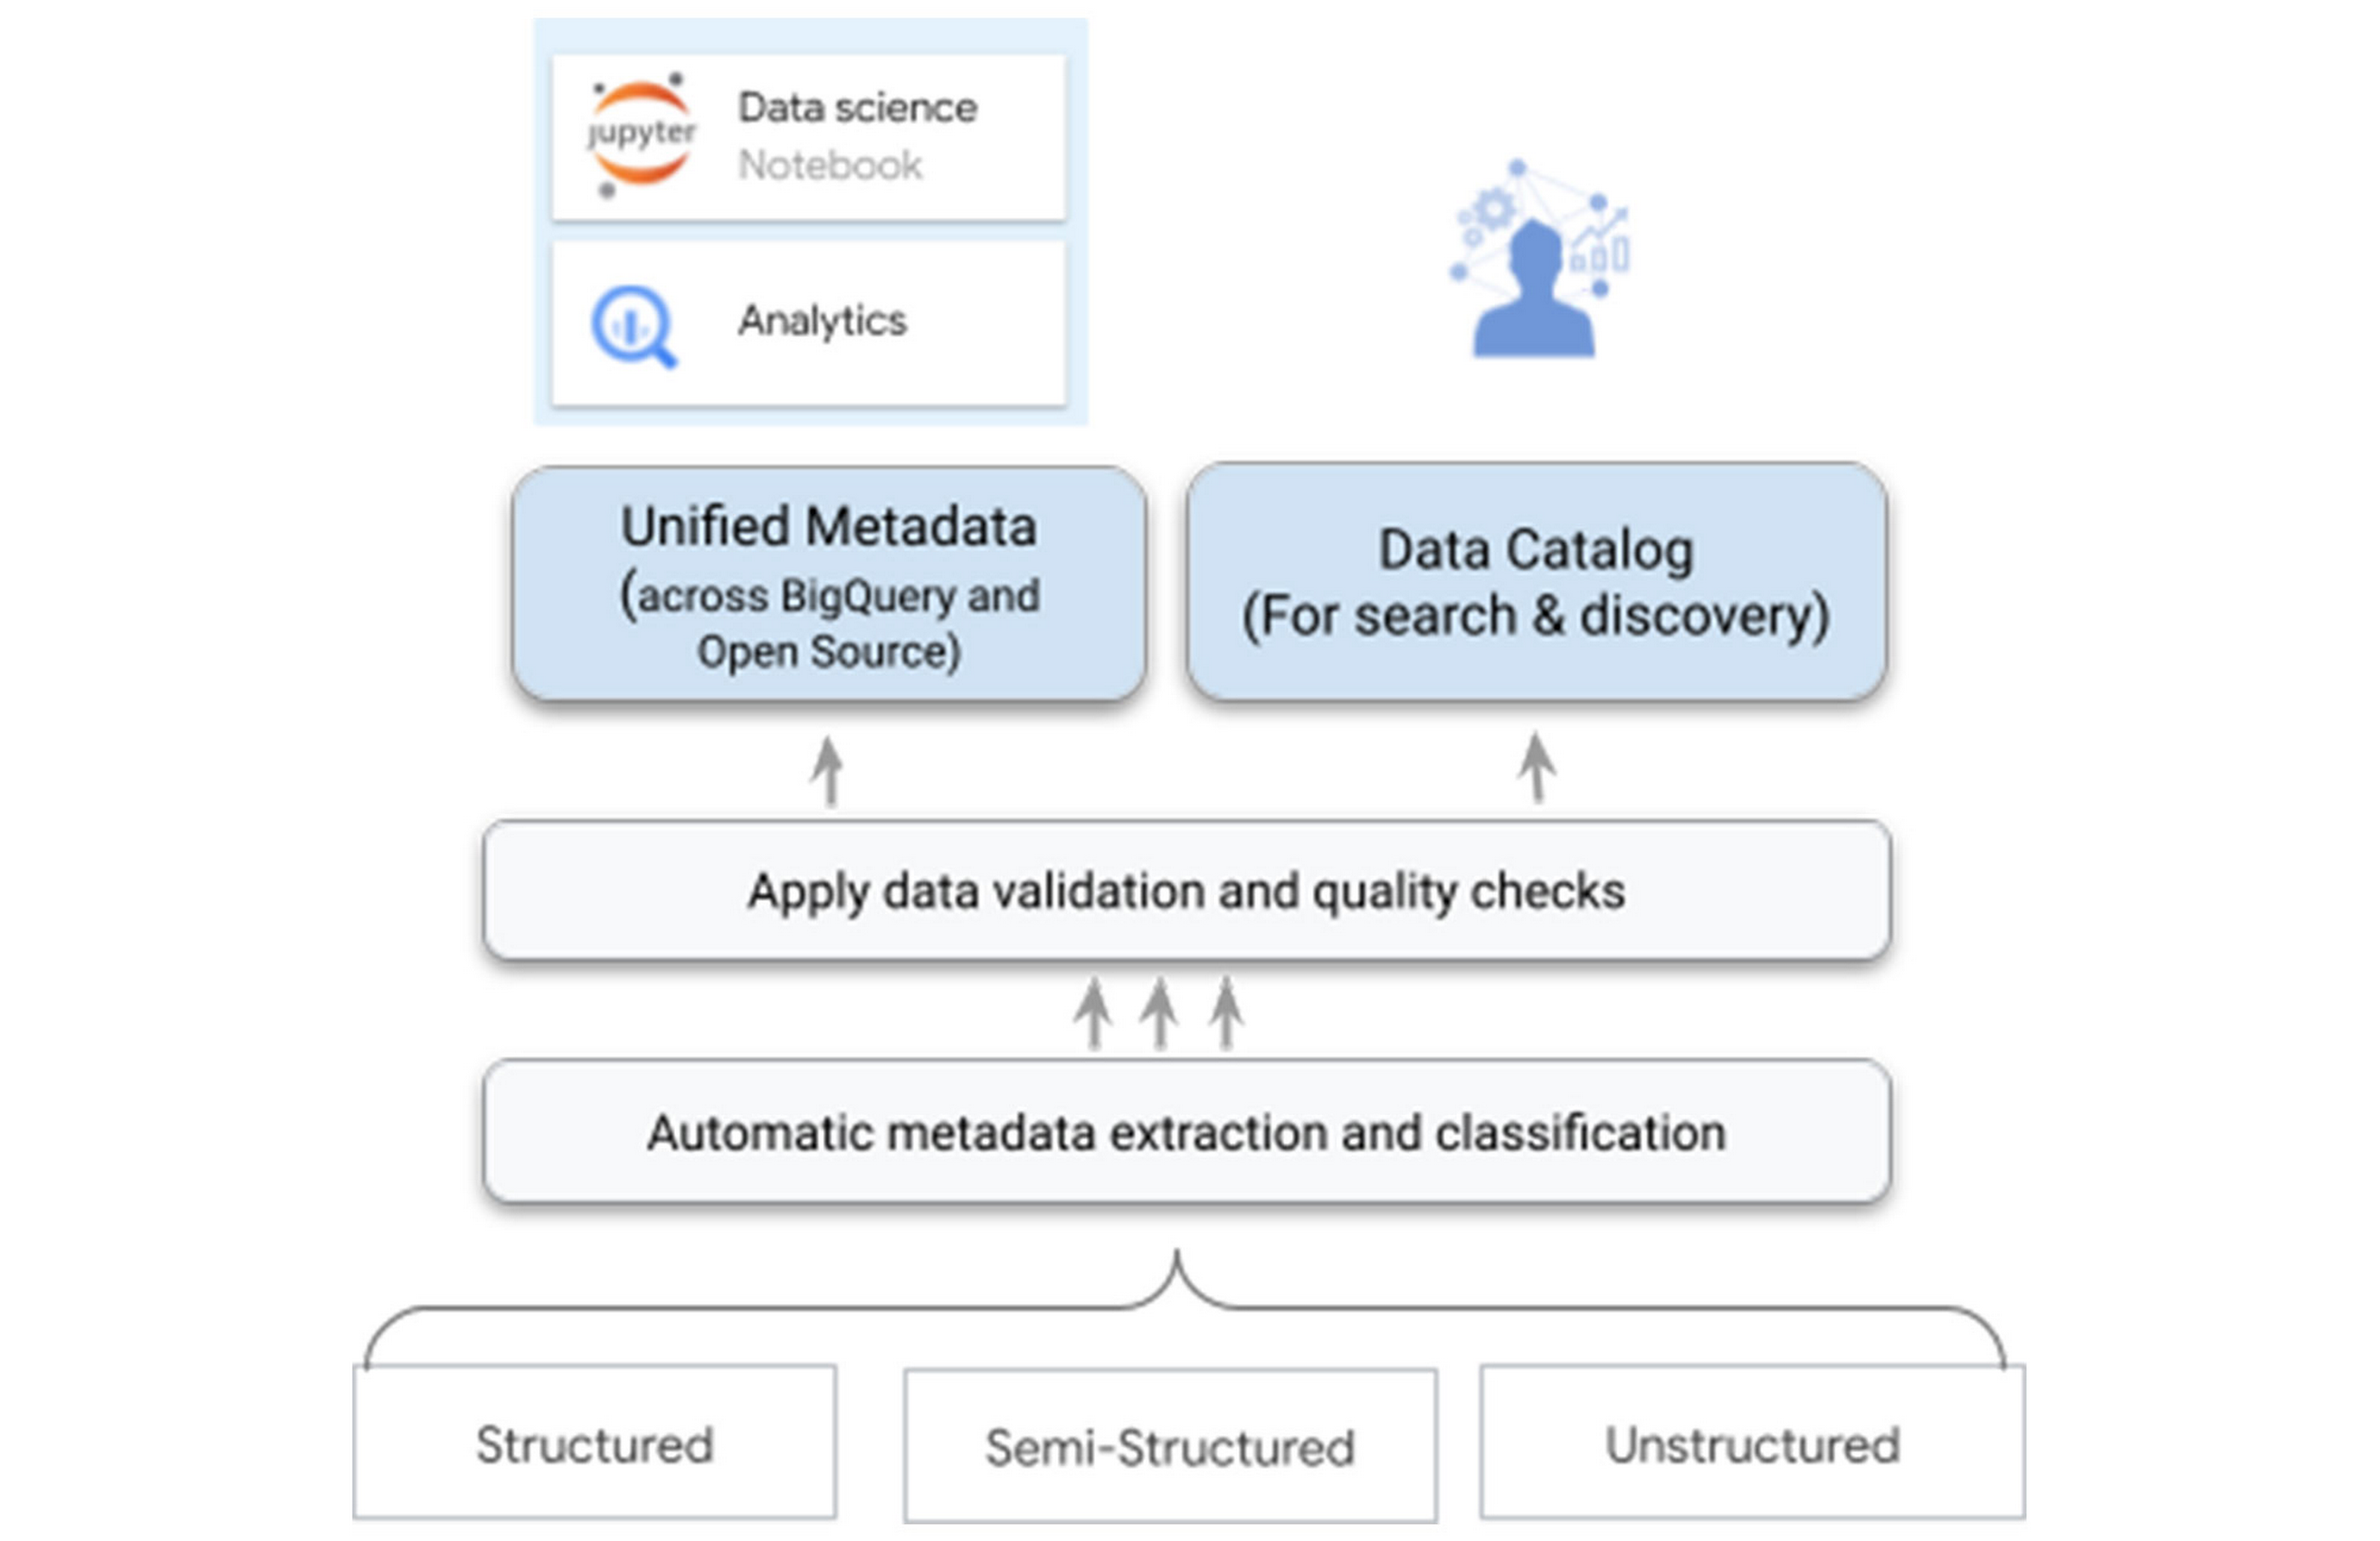
One of the biggest differentiators for Dataplex is our data intelligence capabilities using Google’s best in class AI/ML technologies. As you bring the data under management, Dataplex will automatically harvest the metadata for both structured and unstructured data, with built-in data quality checks. All of the metadata is automatically registered in a unified metastore, and made available for search and discovery. It is also published to Bigquery, Dataproc Metastore, and Data Catalog – ensuring that you have the same consistent data context and access across your tools.
For example, when you write parquet files to a Google Cloud Storage bucket – Dataplex will automatically extract metadata of these files, detect a tabular schema, including hive-style partitions, run data quality checks, and make this data queryable in BigQuery as an external table and from any open source or partner application – with the same consistent security and access policies you defined at the logical data layer.
Your data scientists and analysts now have secured access to this data that meets your quality bar and governance rules via the tools of their choice, without needing any additional processing.
One-click access to collaborative analytics
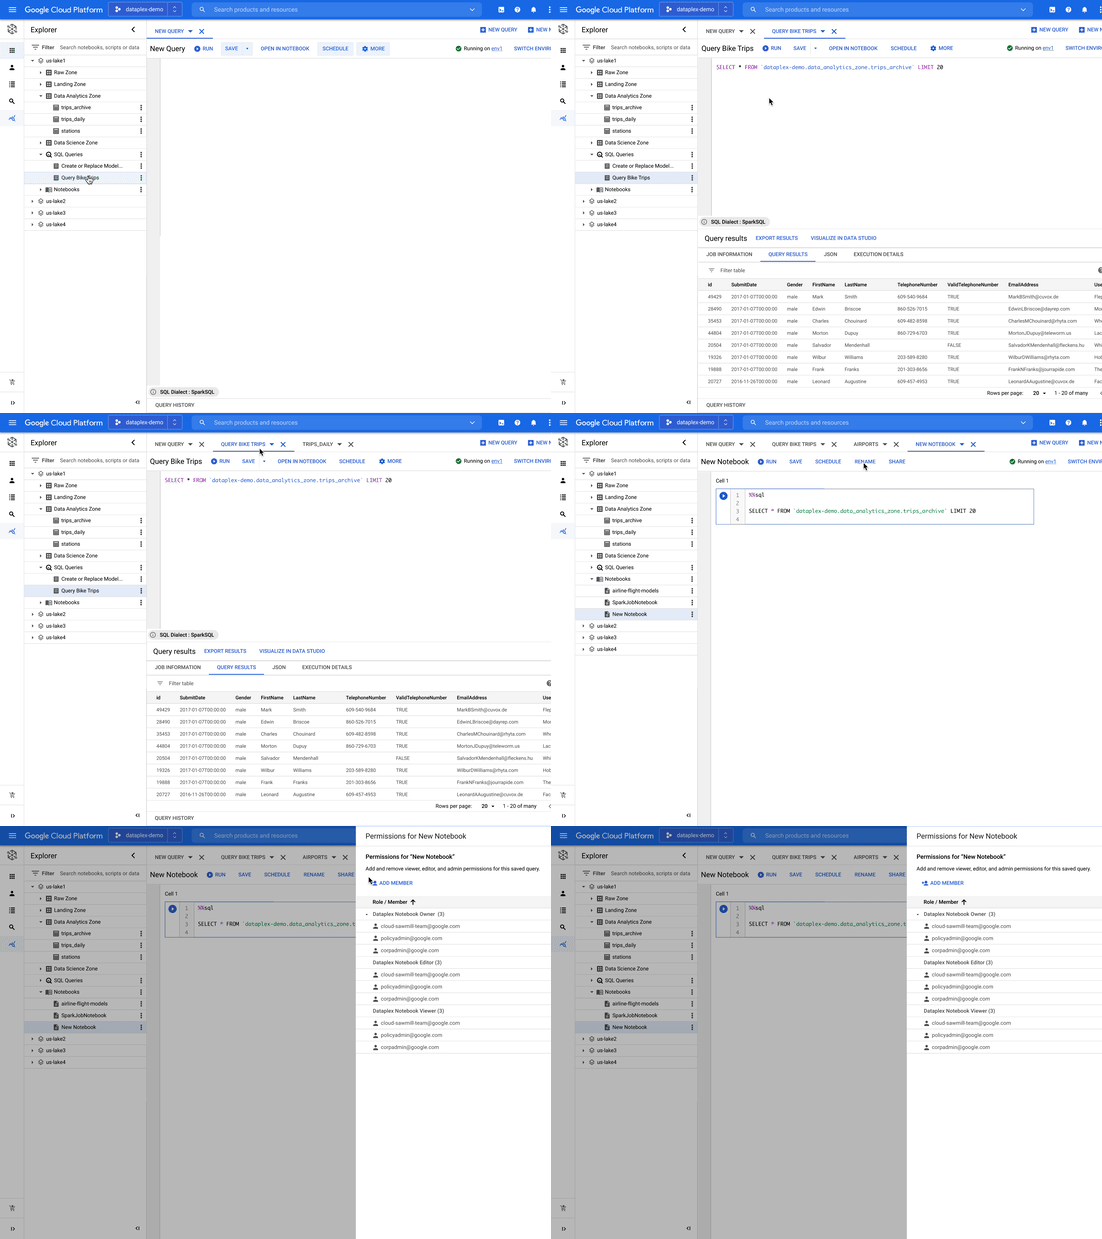
Dataplex provides fully managed, one-click analytics environments enabling you to use the power of Apache Spark and BigQuery with support for other engines coming in the future.
As data administrators, you now have the flexibility to pre-configure these environments with the right cost and financial governance measures without taking on the overhead of managing and maintaining the infrastructure required to power these environments. You can easily configure different environments for different types of workloads and share it with multiple users using their IAM credentials. Dataplex manages the provisioning, monitoring, scaling, and shutdown of these environments.
As data scientists, analysts, and engineers, you now have a turn-key experience to run your analysis using notebooks and a SQL workbench. You can search for notebooks and scripts alongside data, save and share your work with other users, and schedule your notebooks or scripts for recurring workloads – all using the same integrated experience within Dataplex.
Building an open platform with industry leaders
We are partnering with industry leaders such as Accenture, Collibra, Confluent, Informatica, HCL, Starburst, NVIDIA, Trifacta, and others to build an open platform to power analytics at scale. Our partners are excited about the capabilities that Dataplex will provide:
“Collibra is excited to partner with Dataplex to provide data governance and data quality for consistent controls across distributed data. Pairing Collibra’s multi-cloud and hybrid solution with Dataplex allows enterprises to securely open up access to more, higher quality data for users and analytics using a single unified view.”
—Jim Cushman, Chief Product Officer, Collibra
“Dataplex builds on Google Cloud’s commitment to open source by integrating with Apache Kafka®, a leading open source platform for event streaming. We at Confluent, the platform for data in motion that completes Apache Kafka® to be enterprise-ready, are excited to partner with Dataplex to enable customers to bring together distributed, real-time data and build a unified data fabric for end to end analytics.”
—Paul Mac Farland, VP, Head of Customer Solutions and Innovation, Confluent
“We are excited to partner with Google Cloud’s Dataplex team as we look to provide our joint customers an integrated and open data fabric for analytics at scale. Extending Dataplex’s data management and data quality capabilities with Starburst Enterprise will accelerate time to value for enterprises looking to connect distributed data without having to move data.”
—Justin Borgman, CEO and Co-founder, Starburst
Next Steps
Dataplex is now available in preview for a select number of customers. For more information, visit our website or watch the recording. If you would like to sign up, please click here.
Scaling Machine Learning Operations with Vertex AI AutoML and Pipeline

2549
Of your peers have already read this article.
2:30 Minutes
The most insightful time you'll spend today!
When you build a Machine Learning (ML) product, consider at least two MLOps scenarios. First, the model is replaceable, as breakthrough algorithms are introduced in academia or industry. Second, the model itself has to evolve with the data in the changing world.
We can handle both scenarios with the services provided by Vertex AI. For example:
- AutoML capability automatically identifies the best model based on your budget, data, and settings.
- You can easily manage the dataset with Vertex Managed Datasets by creating a new dataset or adding data to an existing dataset.
- You can build an ML pipeline to automate a series of steps that start with importing a dataset and end with deploying a model using Vertex Pipelines.
This blog post shows you how to build this system. You can find the full notebook for reproduction here. Many folks focus on the ML pipeline when it comes to MLOps, but there are more parts to building MLOps as a “system”. In this post, you will see how Google Cloud Storage (GCS) and Google Cloud Functions manage data and handle events in the MLOps system.
Architecture
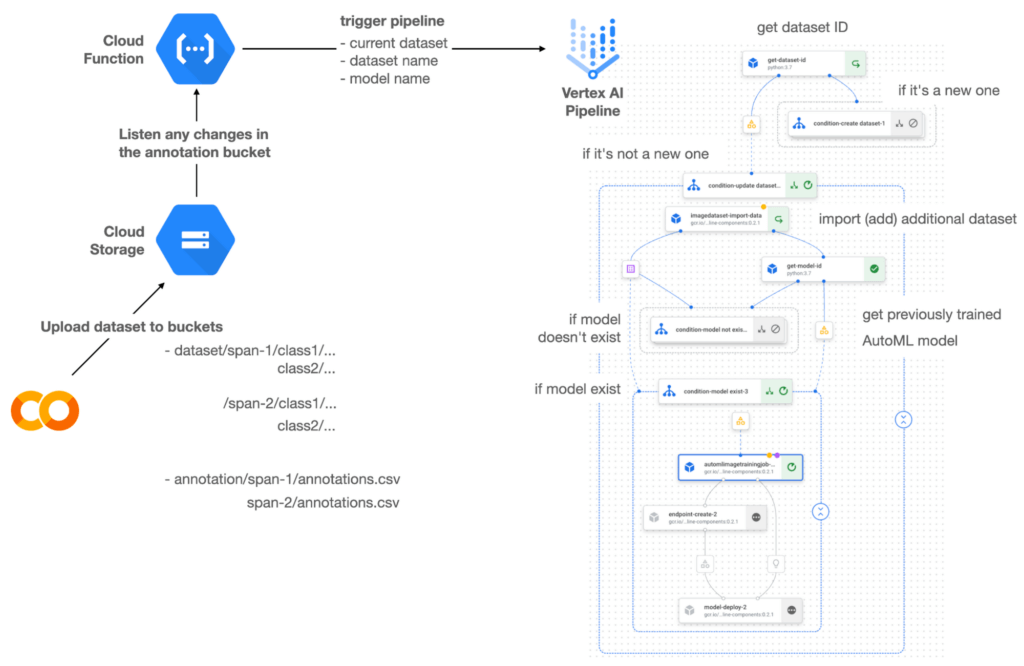

Figure 1 shows the overall architecture presented in this blog. We cover the components and their connection in the context of two common workflows of the MLOps system.
Components
Vertex AI is at the heart of this system, and it leverages Vertex Managed Datasets, AutoML, Predictions, and Pipelines. We can create and manage a dataset as it grows using Vertex Managed Datasets. Vertex AutoML selects the best model without your knowing much about modeling. Vertex Predictions creates an endpoint (RestAPI) to which the client communicates.
It is a simple, fully managed yet somewhat complete end-to-end MLOps workflow moves from a dataset to training a model that gets deployed. This workflow can be programmatically written in Vertex Pipelines. Vertex Pipelines outputs the specification for an ML pipeline allowing you to re-run the pipeline whenever or wherever you want. Specify when and how to trigger the pipeline using Cloud Functions and Cloud Storage.
Cloud Functions is a serverless way to deploy your code in Google Cloud. In this particular project, it triggers the pipeline by listening to changes on the specified Cloud Storage location. Specifically, if a new dataset is added, for example, a new span number is created; the pipeline is triggered to train the dataset, and a new model is deployed.
Workflow
This MLOps system prepares the dataset with either Vertex Dataset’s built-in user interface (UI) or any external tools based on your preference. You can upload the prepared dataset into the designated GCS bucket with a new folder named SPAN-NUMBER. Cloud Functions then detects the changes in the GCS bucket and triggers the Vertex Pipeline to run the jobs from AutoML training to endpoint deployment.
Inside the Vertex Pipeline, it checks if there is an existing dataset created previously. If the dataset is new, Vertex Pipeline creates a new Vertex Dataset by importing the dataset from the GCS location and emits the corresponding Artifact. Otherwise, it adds the additional dataset to the existing Vertex Dataset and emits an artifact.
When the Vertex Pipeline recognizes the dataset as a new one, it trains a new AutoML model and deploys it by creating a new endpoint. If the dataset isn’t new, it tries to retrieve the model ID from Vertex Model and determines whether a new AutoML model or an updated AutoML model is needed. The second branch determines whether the AutoML model has been created. If it hasn’t been created, the second branch creates a new model. Also, when the model is trained, the corresponding component emits the artifact as well.
Directory structure that reflects different distributions
In this project, I have created two subsets of the CIFAR-10 dataset, SPAN-1 and SPAN-2. A more general version of this project can be found here, which shows how to build training and batch evaluation pipelines pipelines. The pipelines can be set up to cooperate so they can evaluate the currently deployed model and trigger the retraining process.
ML Pipeline with Kubeflow Pipelines (KFP)
We chose to use Kubeflow Pipelines to orchestrate the pipeline. There are a few things that I would like to highlight. First, it’s good to know how to make branches with conditional statements in KFP. Second, you need to explore AutoML API specifications to fully leverage AutoML capabilities, such as training a model based on the previously trained one. Last, you also need to find a way to emit artifacts for Vertex Dataset and Vertex Model to consume that Vertex AI can recognize them. Let’s go through these one by one.
Branching strategy
In this project, there are two main conditions and two sub-branches inside the second main branch. The main branches split the pipeline based on a condition if there is an existing Vertex Dataset. The sub-branches are applied in the second main branch, which is selected when there is an exciting Vertex Dataset. It looks up the list of models and decides to train an AutoML model from scratch or a previously trained one.
ML pipelines written in KFP can have conditions with a special syntax of kfp.dsl.Condition. For instance, we can define the branches as follows:
from google_cloud_pipeline_components import aiplatform as gcc_aip


# try to get Vertex Dataset ID
dataset_op = get_dataset_id(...)

with kfp.dsl.Condition(name="create dataset",
                       dataset_op.outputs['Output'] == 'None'):
    # Create Vertex Dataset, train AutoML from scratch, deploy model

with kfp.dsl.Condition(name="update dataset",
                       dataset_op.outputs['Output'] != 'None'):
    # Update existing Vertex Dataset
    ...

    # try to get Vertex Model ID
    model_op = get_model_id(...)

    with kfp.dsl.Condition(name='model not exist',
                           model_op.outputs['Output'] == 'None'):
    # Create Vertex Dataset, train AutoML from scratch, deploy model

    with kfp.dsl.Condition(name='model exist',
                           model_op.outputs['Output'] != 'None'):
        # Create Vertex Dataset, train AutoML based on trained one, deploy model
get_dataset_id and get_model_id are custom KFP components used to determine if there is an existing Vertex Dataset and Vertex Model respectively. Both return “None” if a model is found and some other value if a model isn’t found. They also emit Vertex AI-aware artifacts. You will see what this means in the next section.
Emit Vertex AI-aware artifacts
Artifacts track the path of each experiment in the ML pipeline and display metadata in the Vertex Pipeline UI. When Vertex AI aware artifacts are released into in the pipeline, Vertex Pipeline UI displays links for its internal services such as Vertex Dataset, so that users can visit a web page for more information.
So how could you write a custom component to generate Vertex AI-aware artifacts? To do this, custom components should have Output[Artifact] in their parameters. Then you need to replace the resourceName of the metadata attribute with a special string format.
The following code example is the actual definition of get_dataset_id used in the previous code snippet:
@component(
    packages_to_install=["google-cloud-aiplatform",
                         "google-cloud-pipeline-components"]
)
def get_dataset_id(project_id: str,
                     location: str,
                 dataset_name: str,
                 dataset_path: str,
                      dataset: Output[Artifact]) -> str:
    from google.cloud import aiplatform
    from google.cloud.aiplatform.datasets.image_dataset import ImageDataset
    from google_cloud_pipeline_components.types.artifact_types import VertexDataset


    aiplatform.init(project=project_id, location=location)

    datasets = aiplatform.ImageDataset.list(project=project_id,
                                            location=location,
                                            filter=f'display_name={dataset_name}')

    if len(datasets) > 0:
        dataset.metadata['resourceName'] =
               f'projects/{project_id}/locations/{location}/datasets/{datasets[0].name}'
        return f'projects/{project_id}/locations/{location}/datasets/{datasets[0].name}'
    else:
        return 'None'
As you see, the dataset is defined in the parameters as Output[Artifact]. Even though it appears in the parameter, it is actually emitted automatically. You just need to provide the necessary data as if it is a function variable.
The dataset component retrieves the list of Vertex Dataset by calling the aiplotform.ImageDataset.list API. If the length of it is zero, it simply returns ‘None’. Otherwise, it returns the found resource name of the Vertex Dataset and provides the dataset.metadata[‘resourceName’] with the resource name at the same time. The Vertex AI-aware resource name follows a special string format, which is ‘projects/<project-id>/locations/<location>/<vertex-resource-type>/<resource-name>’.
The <vertex-resource-type>can be anything that points to an internal Vertex AI service. For instance, if you want to specify that the artifact is the Vertex Model, then you should replace <vertex-resource-type> with models. The <resource-name> is the unique ID of the resource, and it can be accessed in the name attribute of the resource found by the aiplatform API. The other custom component, get_model_id, is written in a very similar way as well.
AutoML based on the previous model
You sometimes want to train a new model on top of the previously best model. If that is possible, the new model will probably be much better than the one trained from scratch, because it leverages previously learned knowledge.
Luckily, Vertex AutoML comes with the ability to train a model using a previous model. AutoMLImageTrainingJobRunOp component lets you train a model by simply providing the base_model argument as follows:
training_job_run_op =
gcc_aip.AutoMLImageTrainingJobRunOp(
…,
base_model=model_op.outputs['model'],
…
)
When training a new AutoML model from scratch, you pass ‘None‘ in the base_model argument, and it is the default value. However, you can set it with a VertexModel artifact, and the component will trigger an AutoML training job based on the other model.
One thing to be careful of is that VertexModel artifacts can’t be constructed in a typical way of Python programming That means you can’t create an instance of VertexModel artifact by setting the id found in the Vertex Model dashboard. The only way you can create one is to set the metadata[‘resourceName’] parameters properly. The same rule applies to other Vertex AI-related artifacts such as VertexDataset. You can see how the VertexDataset artifact is constructed properly to get an existing Vertex Dataset to import additional data into it. See the full notebook of this project here.
Cost
You can reproduce the same result from this project with the free $300 credit when you create a new GCP account.
At the time of this blog post, Vertex Pipelines costs about $0.03/run, and the type of underlying VM for each pipeline component is e2-standard-4, which costs about $0.134/hour. Vertex AutoML training costs about $3.465/hour for image classification. GCS holds the actual data, which costs about $2.40/month for 100GiB capacity, and Vertex Dataset is free.
To simulate two different branches, the entire experiment took about one to two hours, and the total cost for this project is approximately $16.59. Please find more detailed pricing information about Vertex AI here.
Conclusion
Many people underestimate the capability of AutoML, but it is a great alternative for app and service developers who have little ML background. Vertex AI is a great platform that provides AutoML as well as Pipeline features to automate the ML workflow. In this article, I have demonstrated how to set up and run a basic MLOps workflow, from data injection to training a model based on the previously-achieved best one, to deploying the model to a Vertex AI platform. With this, we can let our ML model automatically adapt to the changes in a new dataset. What’s left for you to implement is to integrate a model monitoring system to detect data/model drift. One example is found here.
Simplifying Unstructured Data Analytics with BigQuery ML and Vertex AI: A Comprehensive Guide

1540
Of your peers have already read this article.
6:30 Minutes
The most insightful time you'll spend today!
Unstructured data such as images, speech and textual data can be notoriously difficult to manage, and even harder to analyze. The analysis of unstructured data includes use cases such as extracting text from images using OCR, sentiment analysis on customer reviews and simplifying translation for analytics. All of this data needs to be stored, managed and made available for machine learning.
The new BigQuery ML inference engine empowers practitioners to run inferences on unstructured data using pre-trained AI models. The results of these inferences can be analyzed to extract insights and improve decision making. This can all be done in BigQuery, using just a few lines of SQL.
In this blog, we’ll explore how the new BigQuery ML inference engine can be used to run inferences against unstructured data in BigQuery. We’ll demonstrate how to detect and translate text from movie poster images, and run sentiment analysis against movie reviews.
BigQuery ML’s new inference engine
Google Cloud is home to a suite of pre-trained AI models and APIs. The BigQuery ML inference engine can call these APIs and manage the responses on your behalf. All you have to do is define the model you want to use and run inferences against your data. All of this is done in BigQuery using SQL. The inference results are returned in JSON format and stored in BigQuery for analysis.
Why run your inferences in BigQuery?
Traditionally, working with AI models to run inferences required expertise in programming languages like Python. The ability to run inferences in BigQuery using just SQL can make generating insights from your data using AI simple and accessible. BigQuery is also serverless, so you can focus on analyzing your data without worrying about scalability and infrastructure.
The inference results are stored in BigQuery, which allows you to analyze your unstructured data immediately, without the need to move or copy your data. A key advantage here is that this analysis can also be joined with structured data stored in BigQuery, giving you the opportunity to deepen your insights. This can simplify data management and minimize the amount of data movement and duplication required.
Which models are supported?
For now, the BigQuery ML inference engine can be used with these pre-trained Vertex AI models:
- Vision AI API: This model can be used to extract features from images managed by BigQuery Object Tables and stored on Cloud Storage. For example, Vision AI can detect and classify objects, or read handwritten text.
- Translation AI API: This model can be used to translate text in BigQuery tables into over one hundred languages.
- Natural Language Processing API: This model can be used to derive meaning from textual data stored in BigQuery tables. For example, features like sentiment analysis can be used to determine whether the emotional tone of text is positive or negative.
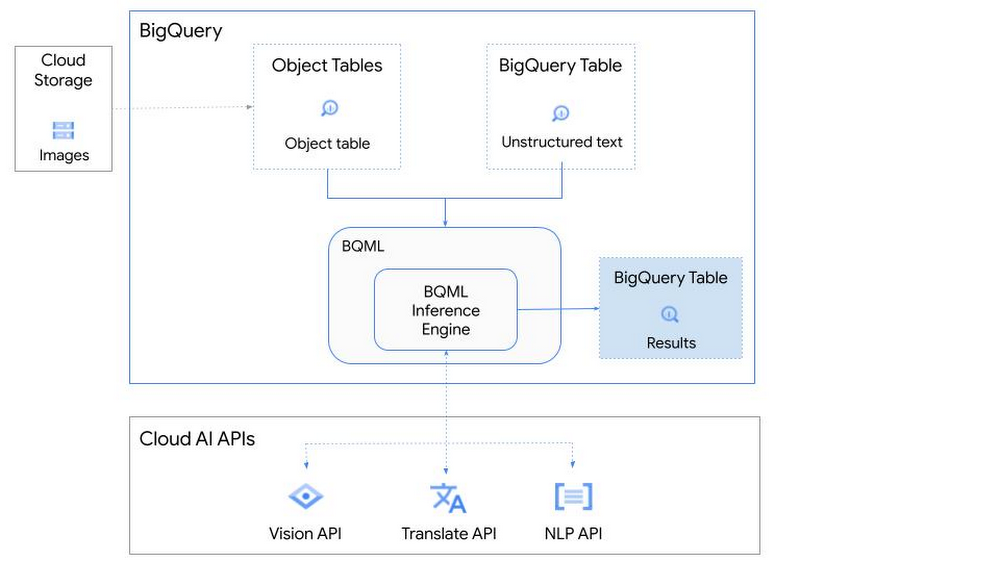
So, how does this work in practice? Let’s look at an example using images of movie posters

- We will define our pre-trained models for Vision AI, Translation AI and NLP AI in BigQuery ML.
- We’ll then use Vision AI to detect the text from some classic movie posters images.
- Next, we’ll use Translation AI to detect any foreign posters and translate them to a language of our choosing – English in this case.
- Finally, we’ll combine our unstructured data with structured data in BigQuery.
We’ll use the extracted movie titles from our movie posters to look up the viewer reviews from the BigQuery IMDB public dataset. We can then run sentiment analysis against these reviews using NLP AI.
Note: The BigQuery ML inference engine is currently in Preview. You will need to complete this enrollment form to have your project allowlisted for use with the BQML Inference Engine.
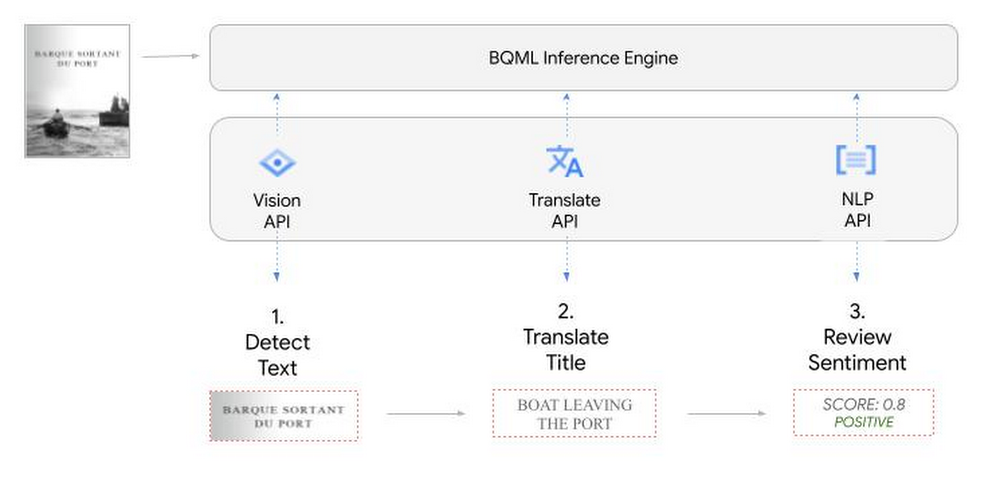
We’ll give examples of the BigQuery SQL needed to define your models and run your inferences. You’ll want to check out our notebook for a detailed guide on how to get this up and running in your Google Cloud project.
1. Define your AI Models in BigQuery
You will need to enable the APIs listed below, and also create a Cloud resource connection to enable BigQuery to interact with these services.
| API | Model Name |
| Vision AI API | Cloud_ai_vision_v1 |
| Translation AI API | Cloud_ai_translate_v3 |
| NLP AI API | Cloud_ai_natural_language_v1 |
You can then run the CREATE MODEL query for each AI service to create your pretrained models, replacing the model_name as required.
CREATE OR REPLACE MODEL
`{PROJECT_ID}.{DATASET_ID}.{VISION_MODEL_NAME}`
REMOTE WITH
CONNECTION `{PROJECT_ID}.{REGION}.{CONN_NAME}`
OPTIONS ( remote_service_type = '<model_name>' );
2. Use the Vision AI API to detect text in images stored in Cloud Storage
You will need to create an object table for your images in Cloud Storage. This read-only object table provides metadata for images stored in Cloud Storage:
CREATE OR REPLACE EXTERNAL TABLE
`{PROJECT_ID}.{DATASET_ID}.{OBJECT_TABLE_NAME}`
WITH
CONNECTION `{REGION}.{CONN_NAME}`
OPTIONS (object_metadata = 'SIMPLE', uris = ['{BUCKET_LOCATION}/*']);
To detect the text from our posters, you can then use ML.ANNOTATE_IMAGE and specify the text_detection feature.
SELECT
       ml_annotate_image_result.full_text_annotation.text AS text_content,
       *
FROM
       ML.ANNOTATE_IMAGE(
         MODEL `{PROJECT_ID}.{DATASET_ID}.{VISION_MODEL_NAME}`,
         TABLE `{DATASET_ID}.{OBJECT_TABLE_NAME}`,
         STRUCT(['TEXT_DETECTION'] AS vision_features));
A JSON response will be returned to BigQuery that includes the text content and language code of the text. You can parse the JSON to a scalar result using the dot annotation highlighted above.

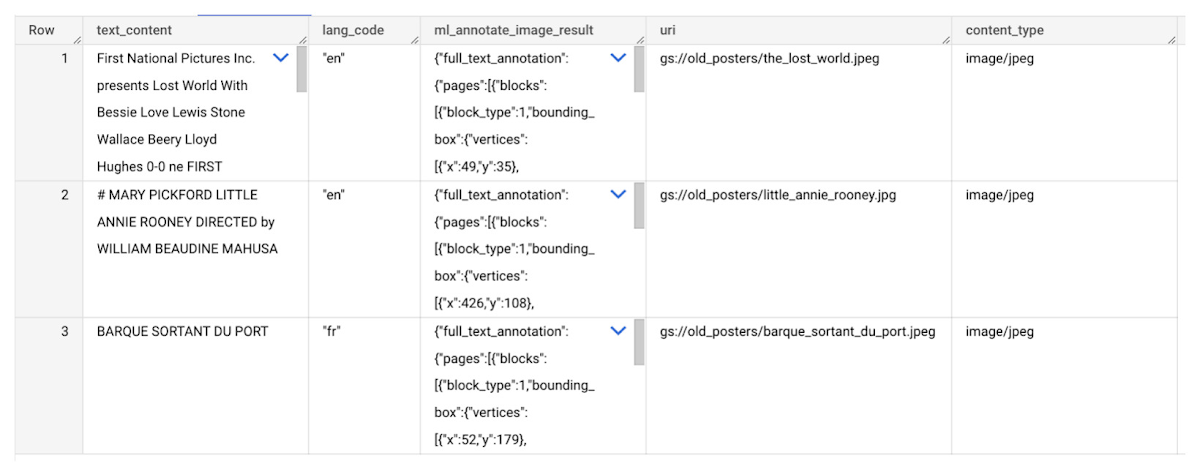
3. Use the Translation AI API to translate foreign movie titles
ML.TRANSLATE can now be used to translate the foreign titles we’ve extracted from our images into English. You just need to specify the target language and the table of the movie posters for translation:
SELECT
text_content,
STRING(ml_translate_result.translations[0].detected_language_code)
as original_language,
STRING(ml_translate_result.translations[0].translated_text)
as translated_title
FROM
  ML.TRANSLATE(
MODEL `{PROJECT_ID}.{DATASET_ID}.{TRANSLATE_MODEL_NAME}`,
TABLE `{DATASET_ID}.image_results`,
STRUCT('TRANSLATE_TEXT' as translate_mode, "en" as target_language_code));
Note: The table column with the text you want to translate must be named text_content:
The table of results will include json that can be parsed to extract both the original language and the translated text. In this case, the model has detected that title text is in French and has translated it to English:

4. Finally, use natural language processing (NLP) to run sentiment analysis against movie reviews
You can easily join inference results from your unstructured data with other BigQuery datasets to bolster your analysis. For example, we can now join the movie titles we extracted from our posters with thousands of movie reviews stored in BigQuery’s IMDB public dataset `bigquery-public-data.imdb.reviews`.
You can use ML.UNDERSTAND_TEXT with the analyze_sentiment feature to run sentiment analysis against some of these reviews to determine whether they are positive or negative:
SELECT
   primary_title, start_year, text_content AS review,
   FLOAT64(ml_understand_text_result.document_sentiment.score) AS score,
   FLOAT64(ml_understand_text_result.document_sentiment.magnitude) AS magnitude,
FROM
   ML.UNDERSTAND_TEXT(
     MODEL `{PROJECT_ID}.{DATASET_ID}.{NLP_MODEL_NAME}`,
           (
           SELECT
             primary_title, start_year, review AS text_content
           FROM
             `bigquery-public-data.imdb.title_basics` titles
           JOIN
             `bigquery-public-data.imdb.reviews` reviews
           ON
             reviews.movie_id = titles.tconst
           WHERE
             UPPER(titles.primary_title) = 'THE LOST WORLD' AND
             start_year = 1925
           ),
      STRUCT("analyze_sentiment" AS nlu_option)) ;
Note: The table column with the text you want to analyze must be named text_content:
The JSON response will include a score and magnitude. The score indicates the overall emotion of the text while the magnitude indicates how much emotional content is present:
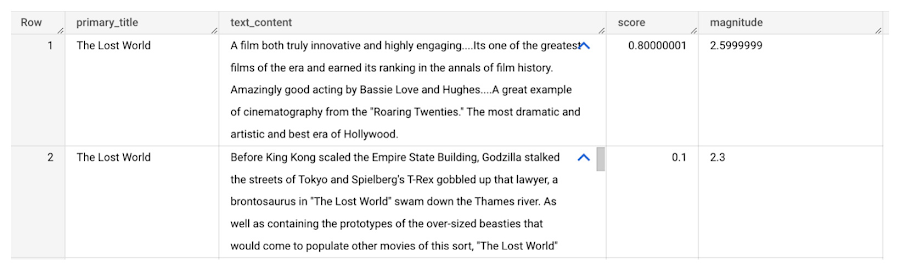
So, how did the Lost World compare with other movies that year?
To wrap up, we’ll compare the average review score of the 1925 Lost World movie to other movies released that year to see which was more popular. This can be done using familiar SQL analysis:
SELECT
 primary_title, start_year,
 AVG(FLOAT64(ml_understand_text_result.document_sentiment.score))AS av_score,
 AVG(FLOAT64(ml_understand_text_result.document_sentiment.magnitude)) AS av_magnitude
FROM
 ML.UNDERSTAND_TEXT(
   MODEL `{PROJECT_ID}.{DATASET_ID}.{NLP_MODEL_NAME}`,
         (
         SELECT
           primary_title, start_year, movie_id, review AS text_content
         FROM
           `bigquery-public-data.imdb.title_basics` titles
         JOIN
           `bigquery-public-data.imdb.reviews` reviews
         ON
           reviews.movie_id = titles.tconst
         WHERE
           start_year = 1925
         ),
   STRUCT("analyze_sentiment" AS nlu_option))
GROUP BY
   primary_title, start_year
ORDER BY
   av_score DESC;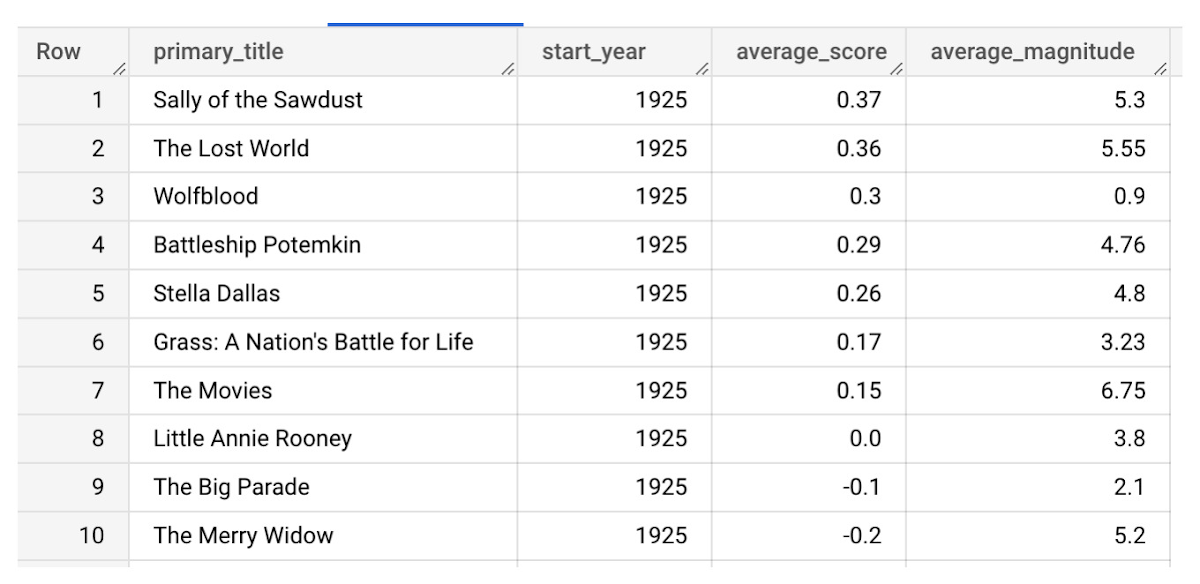
It looks like The Lost World narrowly missed out on the top spot to Sally of the Sawdust!
Want to learn more?
Check out our notebook for a step by step guide on using the BQML inference engine for unstructured data in Google Cloud. You can also check out our Cloud AI service table-valued functions overview page for more details. Curious about pricing? The BQML Pricing page gives a breakdown of how costs are applied across these services.
4568
Of your peers have already watched this video.
32:30 Minutes
The most insightful time you'll spend today!
Technical deep dive on Looker: The enterprise BI solution for Google Cloud
Thousands of users accessing petabytes of data on a daily basis: This is a challenging proposition for enterprises, without a doubt.
But Looker makes it possible. Beyond just accessing data though, Looker’s platform transforms your company’s relationship with data.
Go under the hood of Looker, with Olivia Morgan, Enterprise CE, Looker, to see how LookML empowers developers to take advantage of powerful data warehouses like BigQuery and ultimately enhance the workflows of end users.
She also takes a deep dive into LookML’s ability to use Google Cloud Functions and Search API to enhance dashboards, leverage BQML within Looker’s modeling layer to give users access to forecasts, tie in BigQuery’s public datasets to add richness to analysis, and show off LookML’s ability to handle nested tables for faster performance on transaction analysis all through a complete end to end demo.
A Look Back on Google Cloud’s Data Analytics Development Efforts from June

5957
Of your peers have already read this article.
4:00 Minutes
The most insightful time you'll spend today!
June is the month that holds the summer solstice, and some of us in the northern hemisphere get to enjoy the longest days of sunshine out of the entire year. We used all the hours we could in June to deliver a flurry of new features across BigQuery, Dataflow, Data Fusion, and more. Let’s take a look!
Simple, Sophisticated, and Secure
Usability is a key tenant of our data analytics development efforts. Our new user-friendly BigQuery improvements this month include:
- Flexible data type casting
- Formatting to change column descriptions
- GRANT/REVOKE access control commands using SQL
We hope this will delight data analysts, data scientists, DBAs, and SQL-enthusiasts who can find out more details in our blog here.
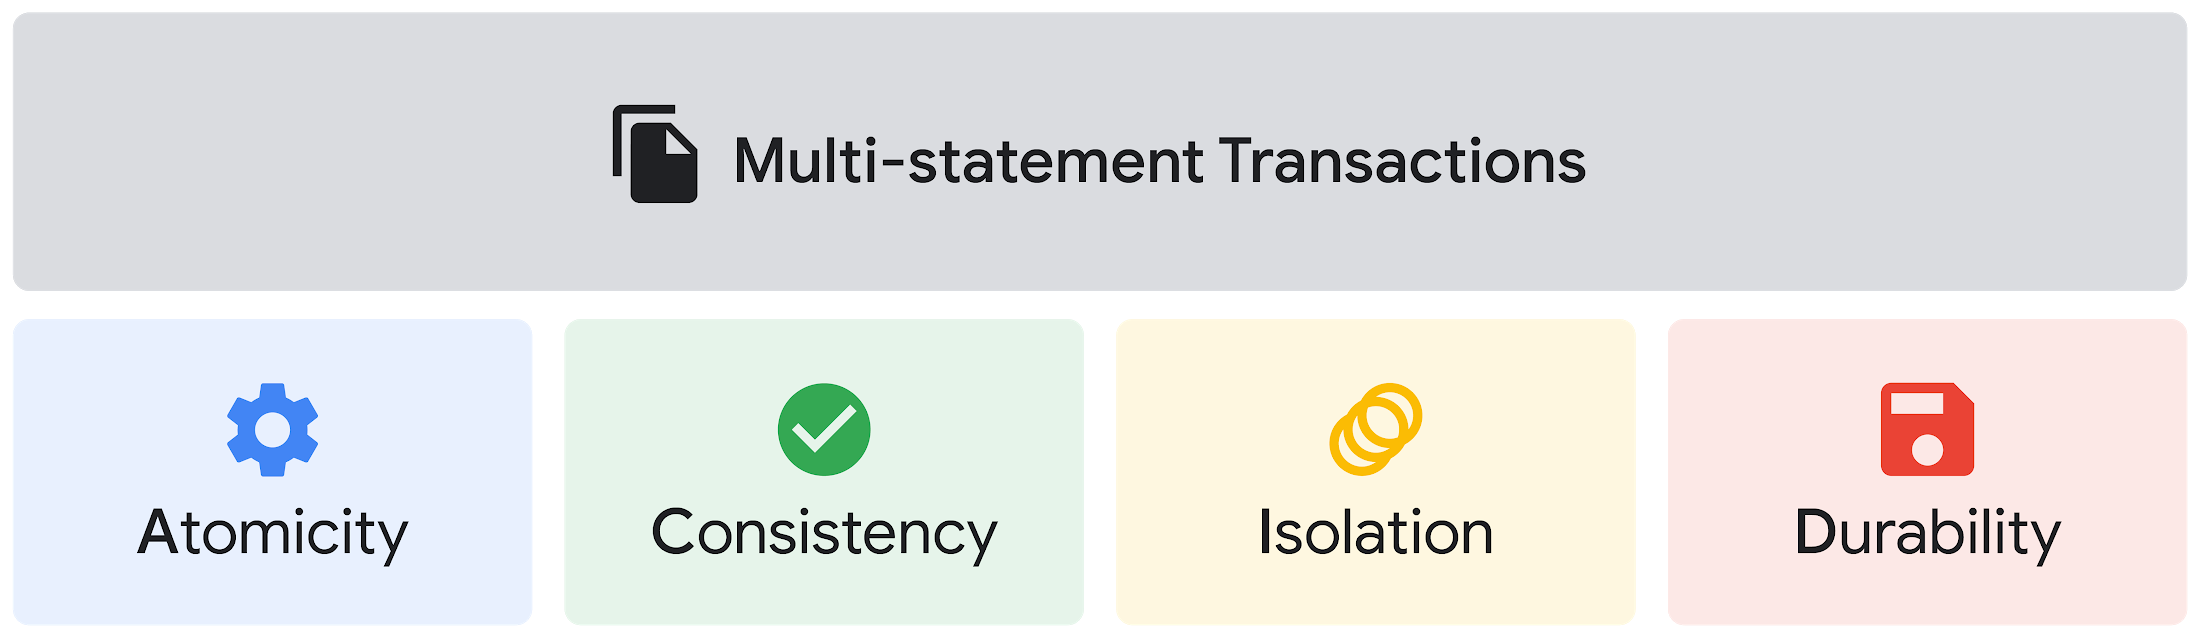
Beyond simplifying commands, we also recognize that it’s equally important to have more sophistication when dealing with transactions. That’s why we introduced multi-statement transactions in BigQuery.
As you probably know, BigQuery has long supported single-statement transactions through DML statements, such as INSERT, UPDATE, DELETE, MERGE and TRUNCATE, applied to one table per transaction. With multi-statement transactions, you can now use multiple SQL statements, including DML, spanning multiple tables in a single transaction.
This means that any data changes across multiple tables associated with all statements in a given transaction are committed atomically (all at once) if successful—or all rolled back atomically in the event of a failure.
We also know that organizations need to control access to data, down to the granular level and that, with the complexity of data platforms increasing day by day, it’s become even more critical to identify and monitor who has access to sensitive data.
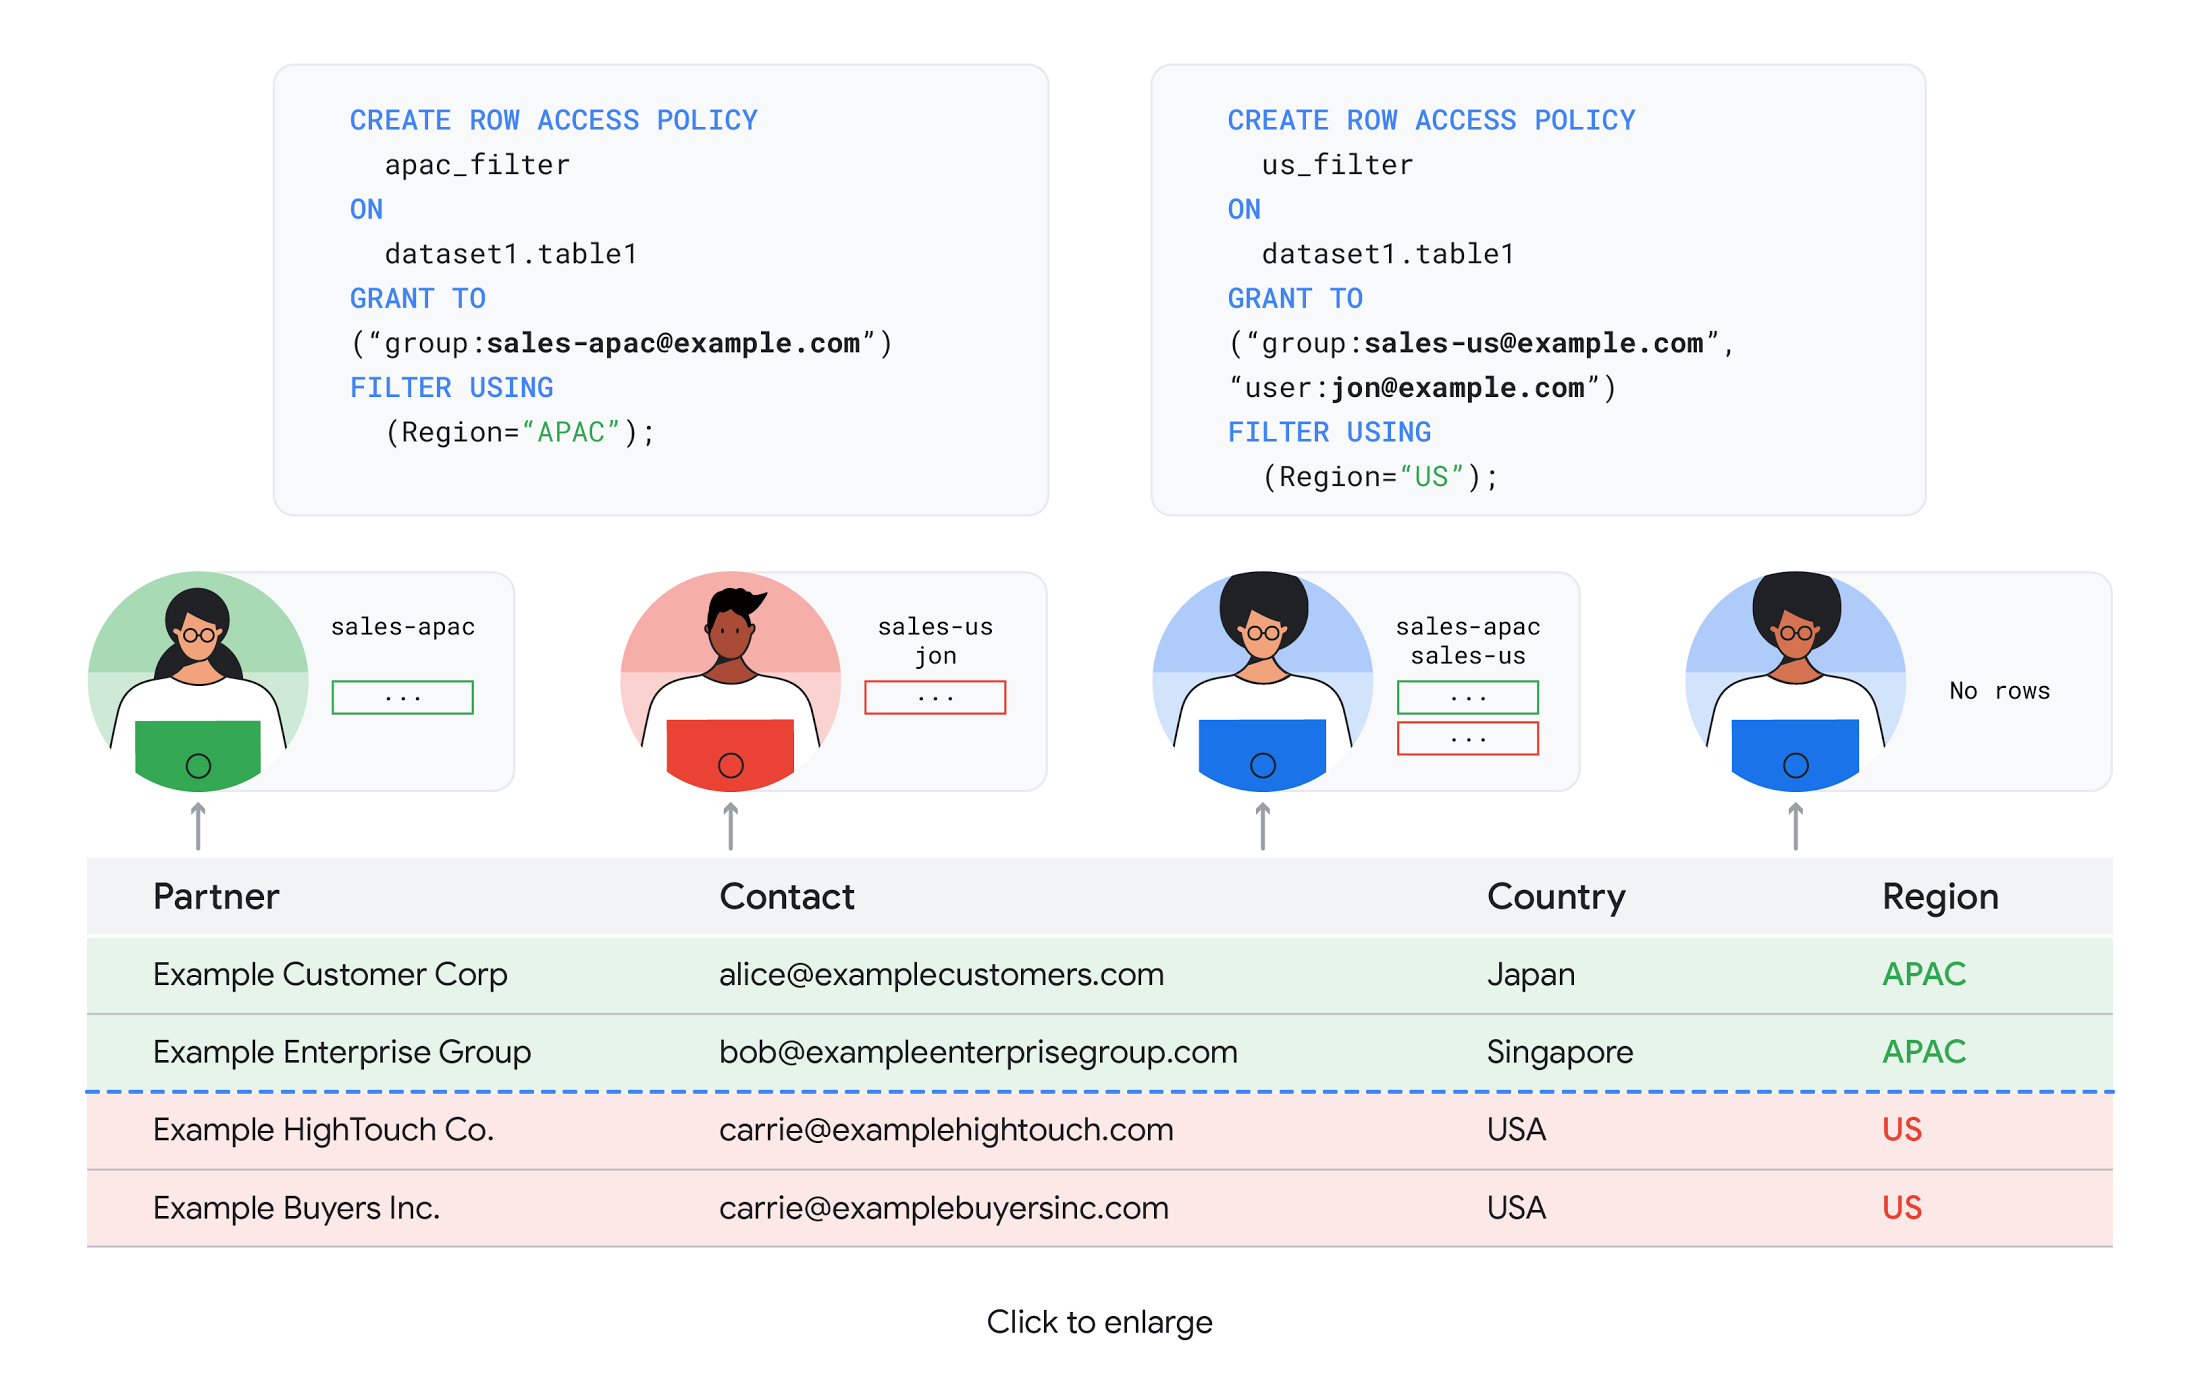
To help address these needs, we announced the general availability of BigQuery row-level security. This capability gives customers a way to control access to subsets of data in the same table for different groups of users. Row-level security in BigQuery enables different user personas access to subsets of data in the same table and can easily be created, updated, and dropped using DDL statements. To learn more, check out the documentation and best practices.
Simple, Safe, and Smart
Beyond building a simpler, more sophisticated and more secure data platform for customers, our team has been focused on providing solutions powered by built-in intelligence. One of our core beliefs is that for machine learning to be adopted and useful at scale, it must be easy to use and deploy.
BigQuery ML, our embedded machine learning capabilities, have been adopted by 80% of our top customers around the globe and it has become a cornerstone of their data to value journey.
As part of our efforts, we announced the general availability of AutoML tables in BigQuery ML. This no-code solution lets customers automatically build and deploy state-of-the-art machine learning models on structured data. With easy integration with Vertex AI, AutoML in BQML makes it simple to achieve machine learning magic in the background. From preprocessing data to feature engineering and model tuning all the way to cross validation, AutoML will “automagically” select and ensemble models so everyone—even non-data scientists—can use it.
Want to take this feature for a test drive? Try it today on BigQuery’s NYC Taxi public dataset following the instructions in this blog!
Speaking of public datasets, we also introduced the availability of Google Trends data in BigQuery to enable customers to measure interest in a topic or search term across Google Search. This new dataset will soon be available in Analytics Hub and will be anonymized, indexed, normalized, and aggregated prior to publication.
Want to ensure your end-cap displays are relevant to your local audience? You can take signals from what people are looking for in your market area to inform what items to place. Want to understand what new features could be incorporated into an existing product based on what people are searching for? Terms that appear in these datasets could be an indicator of what you should be paying attention to.
All this data and technology can be put to use to deploy critical solutions to grow and protect your business. For example, it can be difficult to know how to define anomalies during detection. If you have labeled data with known anomalies, then you can choose from a variety of supervised machine learning model types that are already supported in BigQuery ML.
But what if you don’t know what kind of anomaly to expect, and you don’t have labeled data? Unlike typical predictive techniques that leverage supervised learning, organizations may need to be able to detect anomalies in the absence of labeled data.
That’s why, we were particularly excited to announce the public preview of new anomaly detection capabilities in BigQuery ML that leverage unsupervised machine learning to help you detect anomalies without needing labeled data.
Our team has been working with a large number of enterprises who leverage machine learning for better anomaly detection. In financial services for example, customers have used our technology to detect machine-learned anomalies in real-time foreign exchange data.
To make it easier for you to take advantage of their best practices, we teamed up with Kasna to develop sample code, architecture guidance, and a data synthesizer that generates data so you can test these innovations right away.
Simple, Scalable, and Speedy
Capturing, processing and analyzing data in motion has become an important component of our customer architecture choices. Along with batch processing, many of you need the flexibility to stream records into BigQuery so they can become available for query as they are written.
Our new BigQuery Storage Write API combines the functionality of streaming ingestion and batch loading into a single API. You can use it to stream records into BigQuery or even batch process an arbitrarily large number of records and commit them in a single atomic operation.
Flexible systems that can do batch and real-time in the same environment is in our DNA: Dataflow, our serverless, data processing service for streaming and batch data was built with flexibility in mind.
This principle applies not just to what Dataflow does but also how you can leverage it—whether you prefer using Dataflow SQL right from the BigQuery web UI, Vertex AI notebooks from the Dataflow interface, or the vast collection of pre-built templates to develop streaming pipelines.
Dataflow has been in the news quite a bit recently. You might have noted the recent introduction of Dataflow Prime, a new no-ops, auto-tuning functionality that optimizes resource utilization and further simplifies big data processing. You might have also read that Google Dataflow is a Leader in The 2021 Forrester Wave™: Streaming Analytics, giving Dataflow a score of 5 out of 5 across 12 different criteria.
We couldn’t be more excited about the support the community has provided to this platform. The scalability of Dataflow is unparalleled and as you set your company up for more scale, more speed, and “streaming that screams”, we suggest you take a look at what leaders at Sky, RVU or Palo Alto Networks have already accomplished.
If you’re new to Dataflow, you’re in for a treat: this past month, Priyanka Vergadia (AKA CloudGirl) released a great set of resources to get you started. Read her blog here and watch her introduction video below!
https://youtube.com/watch?v=WRspZRG9e90%3Fenablejsapi%3D1%26
Simple structure that sticks together
We thrive to be the partner of choice for your transformation journey, regardless where your data comes from and how you choose to unify your data stack.
Our partners at Tata Consultancy Services (TCS) recently released research that highlights the importance of a unifying digital fabric and how data integration services like Google Cloud Data Fusion can enable their clients to achieve this vision.
We also announced SAP Integration with Cloud Data Fusion, Google Cloud’s native data integration platform, to seamlessly move data out of SAP Business Suite, SAP ERP and S4/HANA. To date, we provide more than 50 pipelines in Cloud Data Fusion to rapidly onboard SAP data.
This past month, we introduced our SAP Accelerator for Order to Cash. This accelerator is a sample implementation of the SAP Table Batch Source feature in Cloud Data Fusion and will help you get started with your end-to-end order to cash process and analytics.
It includes sample Cloud Data Fusion pipelines that you can configure to connect to your SAP data source, perform transformations, store data in BigQuery, and set up analytics in Looker. It also comes with LookML dashboards which you can access on Github.
Countless great organizations have chosen to work with Google for their SAP data. In June, we wrote about ATB Financial’s journey and how the company uses data to better serve over 800,000 customers, save over CA$2.24 million in productivity, and realize more than CA$4 million in operating revenue through “D.E.E.P”, a data exposure enablement platform built around BigQuery.
Finally, if you are an application developer looking for a unified platform that brings together data from Firebase Crashlytics, Google Analytics, Cloud Firestore, and third party datasets, we have good news!
This past month, we released a unified analytics platform that combines Firebase, BigQuery, Google Looker and FiveTran to easily integrate disparate data sources, and infuse data into operational workflows for greater product development insights and increased customer experience. This resource comes with sample code, a reference guide and a great blog! We hope you enjoy it. See you all next month!
https://youtube.com/watch?v=L25Vfzr2Ciw%3Fenablejsapi%3D1%26
More Relevant Stories for Your Company

New Visual Interface for Google Cloud’s Speech-to-Text API Makes API Easy to Use !
At Google Cloud, we’re committed to making artificial intelligence (AI) accessible to everyone and easier to harness for new use cases. That’s why we’re excited to announce the general availability of our intuitive, new visual user interface for Google Cloud’s Speech-to-Text (STT) API, right in Google Cloud Console, which makes the API

redBus: Mastering Big Data with Google BigQuery
In 2006, online travel agency redBus introduced internet bus ticketing in India, unifying tens of thousands of bus schedules into a single booking operation. (Think of it as Expedia for bus booking.) Using BigQuery, redBus crunches terabytes of booking and inventory data in mere seconds and at a fraction of

Want to Code for the Cloud? Get Started with the Native App Development Track
Earlier this year, we launched the Google Cloud skills challenge, which provides 30 days of free access to training to build your cloud knowledge and an opportunity to earn skill badges that showcase your Google Cloud competencies. Today, we’re adding a Native App Development track to the skills challenge, joining the Getting Started,

Southwire Completes SAP Migration to Google Cloud as a First Step of its Tech Evolution
“Talk about tough times, right?” That’s how Dan Stuart, Senior Vice President of IT Services at Southwire Company, refers to the months following a December 2019 ransomware event, and the COVID crisis that began in spring of 2020. Those events hit just as the company was preparing for an overhaul
