





5133
Of your peers have already watched this video.
15:30 Minutes
The most insightful time you'll spend today!
Analytics in a Multi-Cloud World with BigQuery Omni
Enterprises have more data at hand than they have ever had in the past. But are unable to leverage it fully.
“We have all of this data at our fingertips. But we just can’t quite get to it because we’re living in this world of data silos,” says Emily Rapp, Product Manager, Google Cloud.
Part of the problem is that over 80% of enterprises use more than one cloud provider. For many companies, leveraging a multi-cloud strategy is a competitive advantage, and sometimes a necessity. Multi-cloud allows organizations to meet users where they are and expedite their transformation journey to deliver a compelling customer experience.
So how can data teams manage? That’s why Google Cloud has introduced BigQuery Omni, a flexible, multi-cloud solution that lets you analyze data across clouds.
Watch the video to learn how to break down data silos in your environment and see how you can run analytics in a multi-cloud world.
10144
Of your peers have already watched this video.
1:00 Minutes
The most insightful time you'll spend today!
Predict User Churn on Gaming Apps with Google Analytics Data using BigQuery ML
User retention can be a major challenge for mobile game developers. According to the Mobile Gaming Industry Analysis in 2019, most mobile games only see a 25% retention rate for users after the first day. To retain a larger percentage of users after their first use of an app, developers can take steps to motivate and incentivize certain users to return. But to do so, developers need to identify the propensity of any specific user returning after the first 24 hours.
In this blog post, we will discuss how you can use BigQuery ML to run propensity models on Google Analytics 4 data from your gaming app to determine the likelihood of specific users returning to your app.
You can also use the same end-to-end solution approach in other types of apps using Google Analytics for Firebase as well as apps and websites using Google Analytics 4. To try out the steps in this blogpost or to implement the solution for your own data, you can use this Jupyter Notebook.
Using this blog post and the accompanying Jupyter Notebook, you’ll learn how to:
- Explore the BigQuery export dataset for Google Analytics 4
- Prepare the training data using demographic and behavioural attributes
- Train propensity models using BigQuery ML
- Evaluate BigQuery ML models
- Make predictions using the BigQuery ML models
- Implement model insights in practical implementations
Google Analytics 4 (GA4) properties unify app and website measurement on a single platform and are now default in Google Analytics. Any business that wants to measure their website, app, or both, can use GA4 for a more complete view of how customers engage with their business. With the launch of Google Analytics 4, BigQuery export of Google Analytics data is now available to all users. If you are already using a Google Analytics 4 property, you can follow this guide to set up exporting your GA data to BigQuery.
Once you have set up the BigQuery export, you can explore the data in BigQuery. Google Analytics 4 uses an event-based measurement model. Each row in the data is an event with additional parameters and properties. The Schema for BigQuery Export can help you to understand the structure of the data.
In this blogpost, we use the public sample export data from an actual mobile game app called “Flood It!” (Android, iOS) to build a churn prediction model. But you can use data from your own app or website.
Here’s what the data looks like. Each row in the dataset is a unique event, which can contain nested fields for event parameters.
SELECT *FROM `firebase-public-project.analytics_153293282.events_*`TABLESAMPLE SYSTEM (1 PERCENT)

This dataset contains 5.7M events from over 15k users.
SELECTCOUNT(DISTINCT user_pseudo_id) as count_distinct_users,COUNT(event_timestamp) as count_eventsFROM`firebase-public-project.analytics_153293282.events_*

Our goal is to use BigQuery ML on the sample app dataset to predict propensity to user churn or not churn based on users’ demographics and activities within the first 24 hours of app installation.

In the following sections, we’ll cover how to:
- Pre-process the raw event data from GA4
- Identify users & the label feature
- Process demographic features
- Process behavioral features
- Train classification model using BigQuery ML
- Evaluate the model using BigQueryML
- Make predictions using BigQuery ML
- Utilize predictions for activation
Pre-process the raw event data
You cannot simply use raw event data to train a machine learning model as it would not be in the right shape and format to use as training data. So in this section, we’ll go through how to pre-process the raw data into an appropriate format to use as training data for classification models.
This is what the training data should look like for our use case at the end of this section:

Notice that in this training data, each row represents a unique user with a distinct user ID (user_pseudo_id).
Identify users & the label feature
We first filtered the dataset to remove users who were unlikely to return the app anyway. We defined these ‘bounced’ users as ones who spent less than 10 mins with the app. Then we labeled all remaining users:
- churned: No event data for the user after 24 hours of first engaging with the app.
- returned: The user has at least one event record after 24 hours of first engaging with the app.
For your use case, you can have a different definition of bounce and churning. Also you can even try to predict something else other than churning, e.g.:
- whether a user is likely to spend money on in-game currency
- likelihood of completing n-number of game levels
- likelihood of spending n amount of time in-game etc.
In such cases, label each record accordingly so that whatever you are trying to predict can be identified from the label column.
From our dataset, we found that ~41% users (5,557) bounced. However, from the remaining users (8,031), ~23% (1,883) churned after 24 hours:
SELECTbounced,churned,COUNT(churned) as count_usersFROMbqmlga4.returningusersGROUP BY 1,2ORDER BY bounced

To create these bounced and churned columns, we used the following snippet of SQL code.
...#churned = 1 if last_touch within 24 hr of app installation, else 0IF (user_last_engagement < TIMESTAMP_ADD(user_first_engagement,INTERVAL 24 HOUR),1,0 ) AS churned,#bounced = 1 if last_touch within 10 min, else 0IF (user_last_engagement <= TIMESTAMP_ADD(user_first_engagement,INTERVAL 10 MINUTE),1,0 ) AS bounced,...
You can view the Jupyter Notebook for the full query used for materializing the bounced and churned labels.
Process demographic features
Next, we added features both for demographic data and for behavioral data spanning across multiple columns. Having a combination of both demographic data and behavioral data helps to create a more predictive model.
We used the following fields for each user as demographic features:
geo.countrydevice.operating_systemdevice.language
A user might have multiple unique values in these fields — for example if a user uses the app from two different devices. To simplify, we used the values from the very first user engagement event.
CREATE OR REPLACE VIEW bqmlga4.user_demographics AS (WITH first_values AS (SELECTuser_pseudo_id,geo.country as country,device.operating_system as operating_system,device.language as language,ROW_NUMBER() OVER (PARTITION BY user_pseudo_id ORDER BY event_timestamp DESC) AS row_numFROM `firebase-public-project.analytics_153293282.events_*`WHERE event_name="user_engagement")SELECT * EXCEPT (row_num)FROM first_valuesWHERE row_num = 1 #first engagement);
Process behavioral features
There is additional demographic information present in the GA4 export dataset, e.g. app_info, device, event_params, geo etc. You may also send demographic information to Google Analytics through each hit via user_properties. Furthermore, if you have first-party data on your own system, you can join that with the GA4 export data based on user_ids.
To extract user behavior from the data, we looked into the user’s activities within the first 24 hours of first user engagement. In addition to the events automatically collected by Google Analytics, there are also the recommended events for games that can be explored to analyze user behavior. For our use case, to predict user churn, we counted the number of times the follow events were collected for a user within 24 hours of first user engagement:
user_engagementlevel_start_quickplaylevel_end_quickplaylevel_complete_quickplaylevel_reset_quickplaypost_scorespend_virtual_currencyad_rewardchallenge_a_friendcompleted_5_levelsuse_extra_steps
The following query shows how these features were calculated:
WITHevents_first24hr AS (SELECTe.*FROM`firebase-public-project.analytics_153293282.events_*` eJOINbqmlga4.returningusers rONe.user_pseudo_id = r.user_pseudo_idWHERETIMESTAMP_MICROS(e.event_timestamp) <= r.ts_24hr_after_first_engagement)SELECTuser_pseudo_id,SUM(IF(event_name = 'user_engagement', 1, 0)) AS cnt_user_engagement,# ... repeated for all behavior data ...SUM(IF(event_name = 'use_extra_steps', 1, 0)) AS cnt_use_extra_steps,FROMevents_first24hrGROUP BY1
View the notebook for the query used to aggregate and extract the behavioral data. You can use different sets of events for your use case. To view the complete list of events, use the following query:
SELECTevent_name,COUNT(event_name) as event_countFROM`firebase-public-project.analytics_153293282.events_*`GROUP BY 1ORDER BYevent_count DESC
After this we combined the features to ensure our training dataset reflects the intended structure. We had the following columns in our table:
- User ID:
user_pseudo_id
- Label:
churned
- Demographic features
countrydevice_osdevice_language
- Behavioral features
cnt_user_engagementcnt_level_start_quickplaycnt_level_end_quickplaycnt_level_complete_quickplaycnt_level_reset_quickplaycnt_post_scorecnt_spend_virtual_currencycnt_ad_rewardcnt_challenge_a_friendcnt_completed_5_levelscnt_use_extra_stepsuser_first_engagement
At this point, the dataset was ready to train the classification machine learning model in BigQuery ML. Once trained, the model will output a propensity score between churn (churned=1) or return (churned=0) indicating the probability of a user churning based on the training data.
Train classification model
When using the CREATE MODEL statement, BigQuery ML automatically splits the data between training and test. Thus the model can be evaluated immediately after training (see the documentation for more information).
For the ML model, we can choose among the following classification algorithms where each type has its own pros and cons:

Often logistic regression is used as a starting point because it is the fastest to train. The query below shows how we trained the logistic regression classification models in BigQuery ML.
CREATE OR REPLACE MODEL bqmlga4.churn_logregTRANSFORM(EXTRACT(MONTH from user_first_engagement) as month,EXTRACT(DAYOFYEAR from user_first_engagement) as julianday,EXTRACT(DAYOFWEEK from user_first_engagement) as dayofweek,EXTRACT(HOUR from user_first_engagement) as hour,* EXCEPT(user_first_engagement, user_pseudo_id))OPTIONS(MODEL_TYPE="LOGISTIC_REG",INPUT_LABEL_COLS=["churned"]) ASSELECT*FROMbqmlga4.train
We extracted month, julianday, and dayofweek from datetimes/timestamps as one simple example of additional feature preprocessing before training. Using TRANSFORM() in your CREATE MODEL query allows the model to remember the extracted values. Thus, when making predictions using the model later on, these values won’t have to be extracted again. View the notebook for the example queries to train other types of models (XGBoost, deep neural network, AutoML Tables).
Evaluate model
Once the model finished training, we ran ML.EVALUATE to generate precision, recall, accuracy and f1_score for the model:
SELECT*FROMML.EVALUATE(MODEL bqmlga4.churn_logreg)

The optional THRESHOLD parameter can be used to modify the default classification threshold of 0.5. For more information on these metrics, you can read through the definitions on precision and recall, accuracy, f1-score, log_loss and roc_auc. Comparing the resulting evaluation metrics can help to decide among multiple models.Furthermore, we used a confusion matrix to inspect how well the model predicted the labels, compared to the actual labels. The confusion matrix is created using the default threshold of 0.5, which you may want to adjust to optimize for recall, precision, or a balance (more information here).
SELECTexpected_label,_0 AS predicted_0,_1 AS predicted_1FROMML.CONFUSION_MATRIX(MODEL bqmlga4.churn_logreg)

This table can be interpreted in the following way:

Make predictions using BigQuery ML
Once the ideal model was available, we ran ML.PREDICT to make predictions. For propensity modeling, the most important output is the probability of a behavior occurring. The following query returns the probability that the user will return after 24 hrs. The higher the probability and closer it is to 1, the more likely the user is predicted to return, and the closer it is to 0, the more likely the user is predicted to churn.
SELECTuser_pseudo_id,returned,predicted_returned,predicted_returned_probs[OFFSET(0)].prob as probability_returnedFROMML.PREDICT(MODEL bqmlga4.churn_logreg,(SELECT * FROM bqmlga4.train)) #can be replaced with a proper test dataset
Utilize predictions for activation
Once the model predictions are available for your users, you can activate this insight in different ways. In our analysis, we used user_pseudo_id as the user identifier. However, ideally, your app should send back the user_id from your app to Google Analytics. In addition to using first-party data for model predictions, this will also let you join back the predictions from the model into your own data.
- You can import the model predictions back into Google Analytics as a user attribute. This can be done using the Data Import feature for Google Analytics 4. Based on the prediction values you can Create and edit audiences and also do Audience targeting. For example, an audience can be users with prediction probability between 0.4 and 0.7, to represent users who are predicted to be “on the fence” between churning and returning.
- For Firebase Apps, you can use the Import segments feature. You can tailor user experience by targeting your identified users through Firebase services such as Remote Config, Cloud Messaging, and In-App Messaging. This will involve importing the segment data from BigQuery into Firebase. After that you can send notifications to the users, configure the app for them, or follow the user journeys across devices.
- Run targeted marketing campaigns via CRMs like Salesforce, e.g. send out reminder emails.
You can find all of the code used in this blogpost in the Github repository:
What’s next?
Continuous model evaluation and re-training
As you collect more data from your users, you may want to regularly evaluate your model on fresh data and re-train the model if you notice that the model quality is decaying.
Continuous evaluation—the process of ensuring a production machine learning model is still performing well on new data—is an essential part in any ML workflow. Performing continuous evaluation can help you catch model drift, a phenomenon that occurs when the data used to train your model no longer reflects the current environment.
To learn more about how to do continuous model evaluation and re-train models, you can read the blogpost: Continuous model evaluation with BigQuery ML, Stored Procedures, and Cloud Scheduler
More resources
If you’d like to learn more about any of the topics covered in this post, check out these resources:
- BigQuery export of Google Analytics data
- BigQuery ML quickstart
- Events automatically collected by Google Analytics 4
- Qwiklabs: Create ML models with BigQuery ML
Or learn more about how you can use BigQuery ML to easily build other machine learning solutions:
- How to build demand forecasting models with BigQuery ML
- How to build a recommendation system on e-commerce data using BigQuery ML
Let us know what you thought of this post, and if you have topics you’d like to see covered in the future! You can find us on Twitter at @polonglin and @_mkazi_.Thanks to reviewers: Abhishek Kashyap, Breen Baker, David Sabater Dinter.
Google Cloud Data Heroes Series: Honoring Data Practitioner’s Journey and Learning with GCP
4957
Of your peers have already read this article.
4:00 Minutes
The most insightful time you'll spend today!
Google Cloud Data Heroes is a series where we share stories of the everyday heroes who use our data analytics tools to do amazing things. Like any good superhero tale, we explore our Google Cloud Data Heroes’ origin stories, how they moved from data chaos to a data-driven environment, what projects and challenges they are overcoming now, and how they give back to the community.
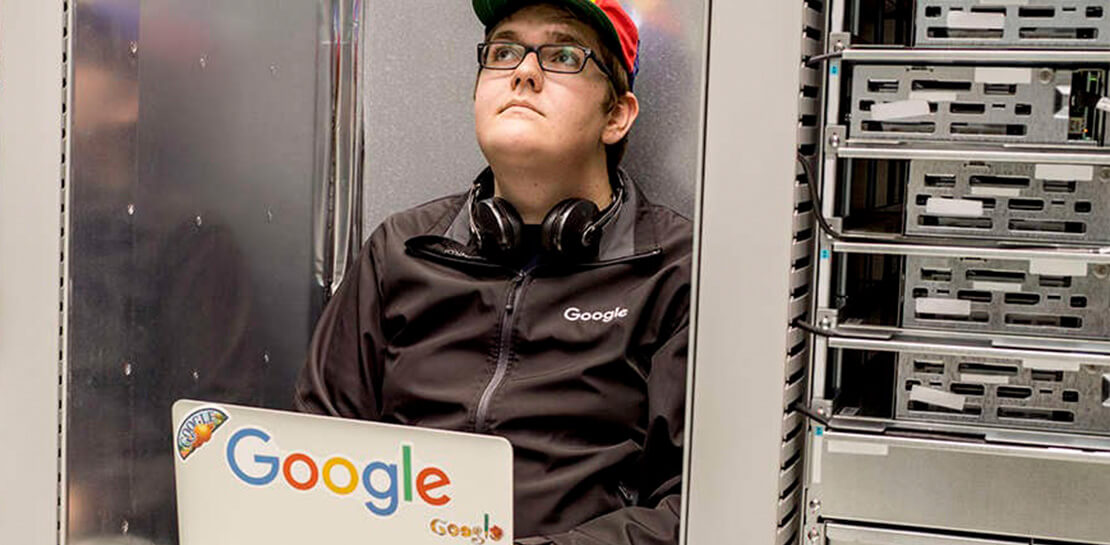
For our first issue, we couldn’t be more excited to introduce Google Cloud Data Heroine Lynn Langit. Lynn is a seasoned business woman in Minnesota beginning her eleventh year as the Founder of her own consulting business, Lynn Langit Consulting LLC. Lynn wears many data professional hats including Cloud Architect, Developer, and Educator. If that wasn’t already a handful, she also loves riding her bike at any given season of the year (pictured on the right), which you might imagine gets a bit challenging when you have to invest in bike studded snow tires!

Tell us how you got to be a data practitioner. What was that experience like and how did this journey bring you to GCP?
I worked on the business side of tech for many years. While I enjoyed my work, I found I was intrigued by the nuanced questions practitioners could ask – and the sophisticated decisions they could make – once they unlocked value from their data. This initial intrigue developed into a strong curiosity and I ultimately made the switch from business worker to data practitioner over 15 years ago. This was a huge change in career considering I got my bachelor’s degree in Linguistics and German. And so I started small. I taught myself most everything both at the beginning and even now through online resources, courses, and materials. I began with database and data warehousing, specifically building and tuning many enterprise databases. It wasn’t until Hadoop/NoSQL became available that I pivoted to Big Data…
Back then, I supplemented my self-paced learning with Microsoft technologies, even earning all Microsoft certifications in just one year. When I noticed the industry shifting from on premise to cloud, I shifted my learning from programming to cloud, too. I have been working in the public cloud for over ten years already!
“I started with AWS, but recently I have been doing most everything in GCP. I particularly love implementing data pipelining, data ops, and machine learning.”
How did you supplement your self teachings with Google Cloud data upskilling opportunities like product deep dives and documentation, courses, skills, and certificates?
One of the first Google Cloud data analytics products I fell in love with was BigQuery. BigQuery was my gateway product into a much larger open, intelligent, and unified data platform full of products that combined data analytics, databases, AI/ML, and business intelligence.
I’ve achieved Skills Badges in BigQuery, Data Analysis, and more. I’ve also achieved Google’s Professional Data Engineer Certification, and have been a Google Developer Expert since 2012.
Most recently, I was named one of few Data Analysis Innovator Champions within the Google Cloud Innovators Program, which I’m particularly excited about because I’ve heard it’s a coveted spot for data practitioners and necessitates a Googler nomination to move from the Innovator membership to Champion title!
You’re undoubtedly a data analytics thought leader in the community. When did you know you moved from data student to data master and what data project are you most excited about?
I knew I had graduated, if you will, to the data architect realm once I was able to confidently do data work that matters, even if that work was outside of my usual domains: adTech and finTech..
For example, my work over the past few years has been around human health outcomes, including combatting the COVID-19 pandemic. I do this by supporting scientists and bioinformatic researchers with genomic-scale data pipelines. Did I know anything about genomics before I started? Not at all! I self-studied bioinformatics and recorded my learnings on GitHub. Along the way I adopted my learnings into an open source GCP course on GitHub aimed at researchers who are new to working with GCP. What’s cool about the course is that I begin from the true basics of how to set up a GCP account. Then I gradually work up to mapping out genomic-scale data workflows, pipelines, analyses, batch jobs, and more using BigQuery and a host of other Google Cloud data products.
Now, I’ve received feedback that this repository has made a positive impact on researchers’ ability to process and synthesize enormous amounts of data quickly. Plus, it achieves the greater goal of broadening accessibility to a public cloud like GCP.
In what ways do you think you uniquely bring value back to the data community? Why is it important to you to give back to the data community?
I stay busy always sharing my learnings back to the community. I record Cloud and Big data technical screencasts (demos) on Youtube, I’ve authored 25 data and cloud courses on LinkedIn Learning, and I occasionally write Medium articles on cloud technology and random thoughts I have about everyday life. I’m also the cofounder of Teaching Kids Programming, with a mission to help equip middle and high school teachers with a great programming curriculum on Java.
Begin your own hero’s journey
Ready to embark on your Google Cloud data adventure? Begin your own hero’s journey with GCP’s recommended learning path where you can achieve badges and certifications along the way. Join the Cloud Innovators program today to stay up to date on more data practitioner tips, tricks, and events.
Connect with Google’s data community at our upcoming virtual event “Latest Google Cloud data analytics innovations”. Register and save your spot now to get your data questions answered live by GCP’s top data leaders and watch demos from our latest products and features including BigQuery, Dataproc, Dataplex, Dataflow, and more. Lynn will take the main stage as an emcee for this event – you won’t want to miss!
Finally, if you think you have a good Data Hero story worth sharing, please let us know! We’d love to feature you in our series as well.
Four Key Takeaways from Google and Quantum Metric’s Back-to-School Retail Benchmark Study

4776
Of your peers have already read this article.
2:00 Minutes
The most insightful time you'll spend today!
Is it September yet? Hardly! School is barely out for the summer. But according to Google and Quantum Metric research, the back-to-school and off-to-college shopping season – which in the U.S. is second only to the holidays in terms of purchasing volume1 – has already begun. For retailers, that means planning for this peak season has kicked off as well.
We’d like to share four key trends that emerged from Google research and Quantum Metric’s Back-to-School Retail Benchmarks study of U.S. retail data, explore the reasons behind them, and outline the key takeaways.
- Out-of-stock and inflation concerns are changing the way consumers shop. Back-to-school shoppers are starting earlier every year, with 41% beginning even before school is out – even more so when buying for college1. Why? The behavior is driven in large part by consumers’ concerns that they won’t be able to get what they need if they wait too long. 29% of shoppers start looking a full month before they need something1.
Back-to-school purchasing volume is quite high, with the majority spending up to $500 and 21% spending more than $1,0001. In fact, looking at year-over-year data, we see that average cart values have not only doubled since November 2021, but increased since the holidays1. And keep in mind that back-to-school spending is a key indicator leading into the holiday season.
That said, as people are reacting to inflation, they are comparing prices, hunting for bargains, and generally taking more time to plan. This is borne out by the fact that 76% of online shoppers are adding items to their carts and waiting to see if they go on sale before making the purchase1. And, to help stay on budget and reduce shipping costs, 74% plan to make multiple purchases in one checkout1. That carries over to in-store shopping, when consumers are buying more in one visit to reduce trips and save on gas.
2. The omnichannel theme continues. Consumers continue to use multiple channels in their shopping experience. As the pandemic has abated, some 82% expect that their back-to-school buying will be in-store, and 60% plan to purchase online. But in any case, 45% of consumers report that they will use both channels; more than 50% research online first before ever setting foot in a store2. Some use as many as five channels, including video and social media, and these 54% of consumers spend 1.5 times more compared to those who use only two channels4.
And mobile is a big part of the journey. Shoppers are using their phones to make purchases, especially for deadline-driven, last-minute needs, and often check prices on other retailers’ websites while shopping in-store. Anecdotally, mobile is a big part of how we ourselves shop with our children, who like to swipe on the phone through different options for colors and styles. We use our desktops when shopping on our own, especially for items that require research and represent a larger investment – and our study shows that’s quite common.
3. Consumers are making frequent use of wish lists. One trend we have observed is a higher abandonment rate, especially for apparel and general home and school supplies, compared to bigger-ticket items that require more research. But that can be attributed in part to the increasing use of wish lists. Online shoppers are picking a few things that look appealing or items on sale, saving them in wish lists, and then choosing just a few to purchase. Our research shows that 39% of consumers build one or two wish lists per month, while 28% said they build one or two each week, often using their lists to help with budgeting1.
4. Frustration rates have dropped significantly. Abandonment rates aside, shopper annoyance rates are down by 41%, year over year1. This is despite out-of-stock concerns and higher prices. But one key finding showed that both cart abandonment and “rage clicks” are more frequent on desktops, possibly because people investing time on search also have more time to complain to customer service.
And frustration does still exist. Some $300 billion is lost each year in the U.S. from bad search experiences5. Data collected internationally shows that 80% of consumers view a brand differently after experiencing search difficulties, and 97% favor websites where they can quickly find what they are looking for5.
Lessons to Learn
What are the key takeaways for retailers? In general, consider the sources of customer pain points and find ways to erase friction. Improve search and personalization. And focus on improving the customer experience and building loyalty. Specifically:
80% of shoppers want personalization6. Think about how you can drive personalized promotions or experiences that will drive higher engagement with your brand.
46% of consumers want more time to research1. Drive toward providing more robust research and product information points, like comparison charts, images, and specific product details.
43% of consumers want a discount1, but given current economic trends, retailers may not be offering discounts. In order to appease budget-conscious shoppers, retailers can consider other retention strategies such as driving loyalty using points, rewards, or faster-shipping perks.
Be sure to keep returns as simple as possible so consumers feel confident when making a purchase, and reduce possible friction points if a consumer decides to make a return. 43% of shoppers return at least a quarter of the products they buy and do not want to pay for shipping or jump through hoops1.
How We Can Help
Google-sponsored research shows that price, deals, and promotions are important to 68% of back-to-school shoppers.7 In addition, shoppers want certainty that they will get what they want. Google Cloud can make it easier for retailers to enable customers to find the right products with discovery solutions. These solutions provide Google-quality search and recommendations on a retailer’s own digital properties, helping to increase conversions and reduce search abandonment. In addition, Quantum Metric solutions, available on the Google Cloud Marketplace, are built with BigQuery, which helps retailers consolidate and unlock the power of their raw data to identify areas of friction and deliver improved digital shopping experiences.
We invite you to watch the Total Retail webinar “4 ways retailers can get ready for back-to-school, off-to college” on demand and to view the full Back-to-School Retail Benchmarks report from Quantum Metric.
Sources:
1. Back-to-School Retail Benchmarks report from Quantum Metric
2. Google/Ipsos,Moments 2021, Jun 2021, Online survey, US, n=335 Back to School shoppers
3. Google/Ipsos, Moments 2021, Jun 2021, Online survey, US, n=2,006 American general population 18+
4. Google/Ipsos, Holiday Shopping Study, Oct 2021 – Jan 2022, Online survey, US, n=7,253, Americans 18+ who conducted holiday shopping activities in past two days
5. Google Cloud Blog, Nov 2021, “Research: Search abandonment has a lasting impact on brand loyalty”
6. McKinsey & Company, “Personalizing the customer experience: Driving differentiation in retail”
7. Think with Google, July 2021, “What to expect from shoppers this back-to-school season”
Your DW Need Scaling Up? Try What This Company Did: It Can Run 25,000 Events a Second

5055
Of your peers have already read this article.
7:30 Minutes
The most insightful time you'll spend today!
With access to more data than ever before, companies have never been better positioned to adopt precision marketing methods and target the right customers at the right time. Emarsys, a digital marketing platform, enables its clients to collect, analyze, and act on a wide variety of data. From websites to mobile apps to emails, Emarsys’ customers can handle data from all its digital channels on a single, easy-to-use platform. Emarsys also makes sure that customers receive the highest quality data possible, making for smarter decisions and better business practices.
“We were close to the limits of our internal data warehouse, scalability-wise. We didn’t want to get to the point where we’d have to delete data or cancel projects. In Google Cloud we saw a platform that could scale with our ambitions and be optimized for AI and real-time solutions.”
—Levente Otti, Head of Data, Emarsys
Since launching as an email solutions provider in 2000, Emarsys has grown into the world’s largest independent digital marketing platform, with more than 2,500 clients worldwide and reaching more than 1.4 billion people. By 2016, the company felt that its existing data warehouse platform was close to its limits, affecting not just day-to-day operations but also important strategic goals.
“We were close to the limits of our internal data warehouse, scalability-wise. We didn’t want to get to the point where we’d have to delete data or cancel projects,” says Levente Otti, Head of Data at Emarsys. “In Google Cloud, we saw a platform that could scale with our ambitions and be optimized for AI and real-time solutions.”
Minimal maintenance, unlimited scale with Google Cloud
Digital marketing is a highly competitive environment. Emarsys works alongside big players with a huge market share on the one hand and smaller, specialist companies on the other. It has thrived by successfully combining the all-inclusive offerings of the former with the agility of the latter, constantly looking for ways to innovate and improve. In recent years, the company had started to feel that the ability to handle large quantities of data was no longer enough. The next challenge was speed. “We truly believe that in the future, everything will be done in real time, including data processing, analytics, and AI predictive models,” Levente says.
At the start of 2016, Emarsys’ existing data warehouse was a software-as-a-service solution running on-premises, which required hardware and software maintenance in order to keep up with the company’s growing appetite for data-heavy use cases such as prediction and analytics. The existing platform had proven its worth processing large amounts of data in batches, but its real-time capabilities were limited. Moreover, Emarsys had begun to experiment with AI technology, but found that its data warehouse couldn’t scale to accommodate some of the more resource-intensive processes, such as training the predictive models. The company decided that it needed a new, cloud-based data platform.
After evaluating some of the leading cloud providers, Emarsys chose Google Cloud for its mature AI capabilities and its ease of use. “With the other solutions, we still had to rent virtual machines and hardware and be responsible for maintenance. At the time, Google Cloud was the only provider that could take that management overhead away from us, while keeping customers accounted for on every query level,” Levente says.
To implement its new data platform, Emarsys teamed up with Google Cloud Partner Aliz. Over a series of meetings, workshops, and architecture reviews, Aliz helped Emarsys navigate the Google Cloud ecosystem to find the right products for the solution it was looking for. “Aliz really helped us set off in the right direction,” explains Levente.
With Google BigQuery, we can run queries which process terabytes of data, in seconds. We can also develop our own user-defined functions, incorporating Bayesian statistics into our predictive algorithms. That means we can take into account historical data, resulting in much more accurate predictions in a scalable way within seconds.”
—Levente Otti, Head of Data, Emarsys
Emarsys’ new data platform would actually be two: one platform for batch processing data and one for real-time analysis and interactions. Firstly, a proprietary publishing component gathered all the data points from Emarsys’ various channels including the website, mobile, emails, and custom events. With Cloud Pub/Sub and Cloud Dataflow, Emarsys transported and processed the data into BigQuery, which allows for further work and reviews that take into account errors or delayed events. After this, the data was exported to the main batch processing platform, which ran on BigQuery. For the real-time analytics, Emarsys used Cloud Bigtable to access data and Cloud Dataflow to pipeline it into the real-time platform, which could communicate with AI components or interaction components via an API to deliver real-time interactions with customers.
On top of the overall data infrastructure, Emarsys built a new AI platform with Google Cloud components. Training the predictive models had been an issue in the past due to the large number of resources required, so Emarsys chose to use Google Kubernetes Engine clusters, which can scale up and down on demand, without the need for hardware configuration or management. The trained models were held securely in Cloud Storage. From here, they were integrated with BigQuery for power and flexibility, allowing Emarsys to improve not just the speed of its AI predictions but also the quality.
“With Google BigQuery, we can run queries which process terabytes of data, in seconds,” shares Levente. “We can also develop our own user-defined functions incorporating Bayesian statistics into our predictive algorithms. That means we can take into account historical data, resulting in much more accurate predictions in a scalable way within seconds.”
Real-time insight, long-term satisfaction
Google Cloud enabled Emarsys to build a scalable data and AI platform that delivers powerful, actionable insights in real time. According to Levente, the company wanted to spend less time managing overload and more time considering how it should handle data. An immediate result of the new platform has been that data is now available in a scalable way, without hardware additions and management.
“With Google Cloud, we’ve been able to build a truly real-time data platform. The norm used to be daily batch processing of data. Now, if an event happens, marketing actions can be executed within seconds, and customers can react immediately. That makes us very competitive in our market.”
—Levente Otti, Head of Data, Emarsys
The clear and innovative pricing schemes of Google Cloud have also brought a new level of accountability to Emarsys’ costs in a way that wasn’t possible with its on-premises infrastructure. “Now that we only pay for what we use, we can assign costs to specific customers or queries, which has a huge impact on our pricing and product development strategies,” says Levente.
Thanks to the power of BigQuery and the scale at which it can handle data, Emarsys can now apply its analytics and AI tools to their full potential. “It’s very important to enable our clients to create the best possible experience for customers,” says Levente. At the same time, the company has cut its AI platform costs by 70% with Kubernetes while increasing scalability compared to the previous solution. The whole data platform was built to be scalable, and its first big test came during the retail peak of Black Friday, when it comfortably handled 250,000 events per second. “Perhaps the biggest impact on the business came with the real-time nature of the new platform,” says Levente.
“With Google Cloud, we’ve been able to build a truly real-time data platform,” he explains. “The norm used to be daily batch processing of data. Now, if an event happens, marketing actions can be executed within seconds, and customers can react immediately. That makes us very competitive in our market.”
Since implementing the new platform, Emarsys has continued to innovate with it and is about to release a new Real-Time Decision Framework, which will provide customers with even more real-time products and tools. The company continues to work with Aliz and Google Cloud, exploring other products such as Google BigQuery ML and TensorFlow to improve its AI processes. “We had a problem that we wanted to tackle now, and for us, Google Cloud was the best way of doing that,” says Levente. “But it was also about looking ahead. We felt that Google Cloud offered us the best way of future-proofing our platform.”

NVIDIA and Google Cloud Pave the Way for Single-cell Genomic Analysis

2998
Of your peers have already read this article.
2:00 Minutes
The most insightful time you'll spend today!
In the past decade, the Healthcare and Life Sciences industry has enjoyed a boon in technological and scientific advancement. New insights and possibilities are revealed almost daily. At Google Cloud, driving innovation in cloud computing is in our DNA. Our team is dedicated to sharing ways Google Cloud can be used to accelerate scientific discovery. For example, the recent announcement of AlphaFold2 showcases a scientific breakthrough, powered by Google Cloud, that will promote a quantum leap in the field of proteomics. In this blog, we’ll review another omics use case, single-cell analysis, and how Google Cloud’s Dataproc and NVIDIA GPUs can help accelerate that analysis.
The Need for Performance in Scientific Analysis
The ability to understand the causal relationship between genotypes and phenotypes is one of the long-standing challenges in biology and medicine. Understanding and drawing insights from the complexity of biological systems abounds from the actual code of life (DNA) through to expression of genes (RNA) to translation of gene transcripts into proteins that function in different pathways, cells, and tissues within an organism. Even the smallest of changes in our DNA can have large impacts on protein expression, structure, and function, which ultimately drives development and response – at both cellular and organism levels. And, as the omics space becomes increasingly data- and compute-intensive, research requires an adequate informatics infrastructure. An infrastructure that scales with growing data demands, enables a diverse range of resource-intensive computational activities, and is affordable and efficient – reducing data bottlenecks and enabling researchers to maximize insight.
But where do all these data and compute challenges come from and what makes scientific study so arduous? The layers of biological complexity begin to be made apparent immediately when looking at not just the genes themselves, but their expression. Although all the cells in our body share nearly identical genotypes, our many diverse cell types (e.g. hepatocytes versus melanocytes) express a unique subset of genes necessary for specific functions, making transcriptomics a more powerful method of analysis by allowing researchers to map gene expression to observable traits. Studies have shown that gene expression is heterogeneous, even in similar cell types. Yet, conventional sequencing methods require DNA or RNA extracted from a cell population. The development of single-cell sequencing was pivotal to the omics field. Single-cell RNA sequencing has been critical in allowing scientists to study transcriptomes across large numbers of individual cells.
Despite its potential, and the increasing availability of single-cell sequencing technology, there are several obstacles: an ever increasing volume of high-dimensionality data, the need to integrate data across different types of measurements (e.g. genetic variants, transcript and protein expression, epigenetics) and across samples or conditions, as well as varying levels of resolution and the granularity needed to map specific cell types or states. These challenges present themselves in a number of ways including background noise, signal dropouts requiring imputation, and limited bioinformatics pipelines that lack statistical flexibility. These and other challenges result in analysis workflows that are very slow, prohibiting the iterative, visual, and interactive analysis required to detect differential gene activity.
Accelerating Performance
Cloud computing can help not only with data challenges, but with some of the biggest obstacles: scalability, performance, and automation of analysis. To address several of the data and infrastructure challenges facing single-cell analysis, NVIDIA developed end-to-end accelerated single-cell RNA sequencing workflows that can be paired with Google Cloud Dataproc, a fully-managed service for running open source frameworks like Spark, Hadoop, and RAPIDS. The Jupyter notebooks that power these workflows include examples using samples like human lung cells and mouse brains cells and demonstrate acceleration between CPU-based processing compared to GPU-based workflows.
Google Cloud Dataproc powers the NVIDIA GPU-based approach and demonstrates data processing capabilities and acceleration, which in turn have the potential of delivering considerable performance gains. When paired with RAPIDS, practitioners can accelerate data science pipelines on NVIDIA GPUs, reducing operations like data loading, processing, and training from hours to seconds. RAPIDS abstracts the complexities of accelerated data science by building upon popular Python and Java libraries effortlessly. When applying RAPIDS and NVIDIA accelerated compute to single-cell genomics use cases, practitioners can churn through analysis of a million cells in only a few minutes.
Give it a Try
The journey to realizing the full potential of omics is long; but through collaboration with industry experts, customers, and partners like NVIDIA, Google Cloud is here to help shine a light on the road ahead. To learn more about the notebook provided for single-cell genomic analysis, please take a look at NVIDIA’s walkthrough. To give this pattern a try on Dataproc, please visit our technical reference guide.
More Relevant Stories for Your Company

Technical deep dive on Looker: The enterprise BI solution for Google Cloud
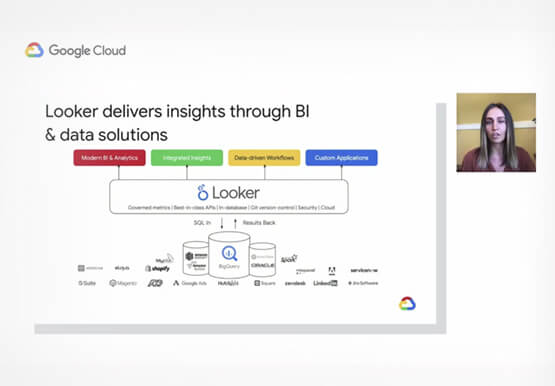
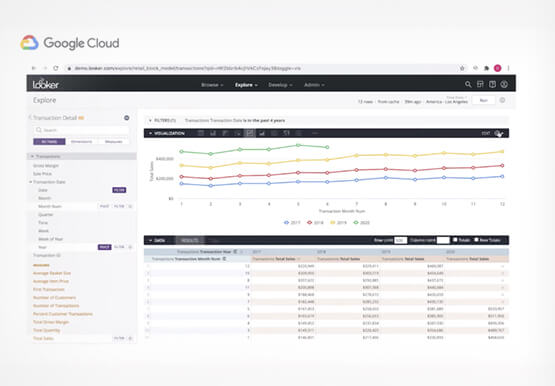
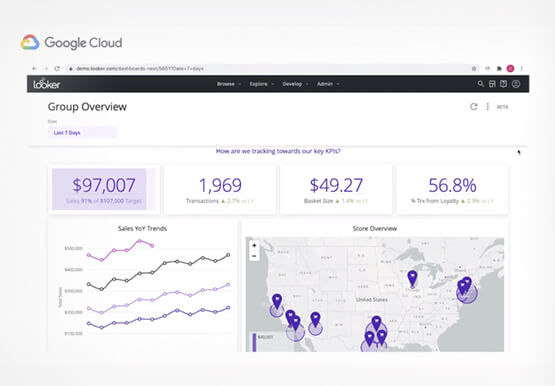
Thousands of users accessing petabytes of data on a daily basis: This is a challenging proposition for enterprises, without a doubt. But Looker makes it possible. Beyond just accessing data though, Looker’s platform transforms your company’s relationship with data. Go under the hood of Looker, with Olivia Morgan, Enterprise CE,

Data Cloud Skills to Pick Up in 2022: Google Experts Recommended
It’s 2022 and nanosatellites, NFTs, and autonomous cars that deliver your pizza are in full force. In a world where people rely on simple technology to untangle complex problems, companies must deliver simple experiences to be successful in today’s landscape. For many cloud providers this means enabling tightly integrated data

Google Cloud’s Data Analytics May Recap
May was a very busy month for data analytics product innovation. If you didn’t have the chance to attend our inaugural Data Cloud Summit, video replays of all our sessions are now available so feel free to watch them at your own pace. In this blog, I’d like to share some background behind

This Chart, from Home Depot, Dramatically Demonstrates the Power of a Cloud Data Warehouse
The Home Depot (THD) is the world’s largest home-improvement chain, growing to more than 2,200 stores and 700,000 products in four decades. Much of that success was driven through the analysis of data. This included developing sales forecasts, replenishing inventory through the supply chain network, and providing timely performance scorecards. However,
