





Power up Caching with Memorystore for Memcached

3942
Of your peers have already read this article.
2:30 Minutes
The most insightful time you'll spend today!
In-memory data stores are a fundamental infrastructure for building scalable, high-performance applications. Whether it is building a highly responsive ecommerce website, creating multiplayer games with thousands of users, or doing real-time analysis on data pipelines with millions of events, an in-memory store helps provide low latency and scale for millions of transactions. Redis is a popular in-memory data store for use cases like session stores, gaming leaderboards, stream analytics, API rate limiting, threat detection, and more. Another in-memory data store, open source Memcached, continues to be a very popular choice as a caching layer for databases and is used for its speed and simplicity.
We’re announcing Memorystore for Memcached in beta, a fully managed, highly scalable service that’s compatible with the open source Memcached protocol. We launched Memorystore for Redis in 2018 to let you use the power of open source Redis easily without the burden of management. This announcement brings even more flexibility and choice for your caching layer.
Highlights of Memorystore for Memcached
Memcached offers a simple but powerful in-memory key value store and is popular as a front-end cache for databases. Using Memcached as a front-end store not only provides an in-memory caching layer for faster query processing, but it can also help save costs by reducing the load on your back-end databases.
Using Memorystore for Memcached provides several important benefits:
- Memorystore for Memcached is fully open source protocol compatible. If you are migrating applications using self-deployed Memcached or other cloud providers, you can simply migrate your application with zero code changes.
- Memorystore for Memcached is fully managed. All the common tasks that you spend time on, like deployment, scaling, managing node configuration on the client, setting up monitoring, and patching, are all taken care of. You can focus on building your applications.
- Right-sizing a cache is a common challenge with distributed caches. The scaling feature of Memorystore for Memcached, along with detailed open source Memcached monitoring metrics, allows you to scale your instance up and down easily to optimize for your cache-hit ratio and price. With Memorystore for Memcached, you can scale your cluster up to 5 TB per instance.
- Auto-discovery protocol lets clients adapt to changes programmatically, making it easy to deal with changes to the number of nodes during scaling. This drastically reduces manageability overhead and code complexity.
- You can monitor your Memorystore for Memcached instances with built-in dashboards in the Cloud Console and rich metrics in Cloud Monitoring.
Memorystore for Memcached can be accessed from applications running on Compute Engine, Google Kubernetes Engine (GKE), App Engine Flex, App Engine Standard, and Cloud Functions.
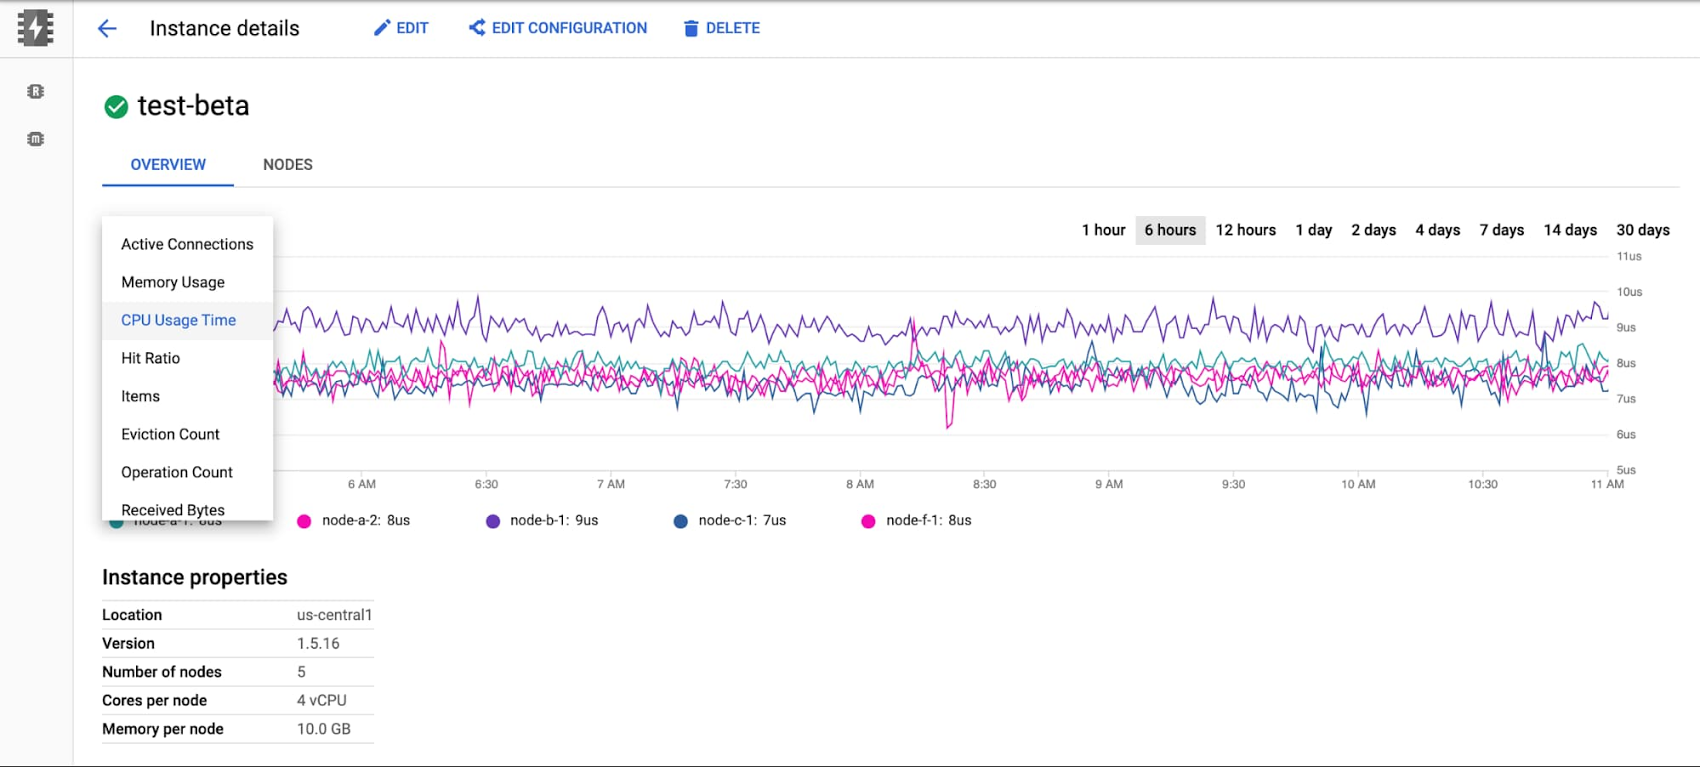
The beta launch is available in major regions across the U.S., Asia, and Europe, and will be available globally soon.
Getting started with Memorystore for Memcached
To get started with Memorystore for Memcached, check out the quick start guide. Sign up for a $300 credit to try Memorystore and the rest of Google Cloud. You can start with the smallest instance and when you’re ready, you can easily scale up to serve performance-intensive applications. Enjoy your exploration of Google Cloud and Memorystore for Memcached.
Gartner Positions Google as the Leader for Cloud Database Management Systems!

3609
Of your peers have already read this article.
1:30 Minutes
The most insightful time you'll spend today!
We are thrilled that Gartner has positioned Google as a Leader for the second year in a row in the 2021 Gartner® Magic Quadrant™ for Cloud Database Management Systems (DBMS).
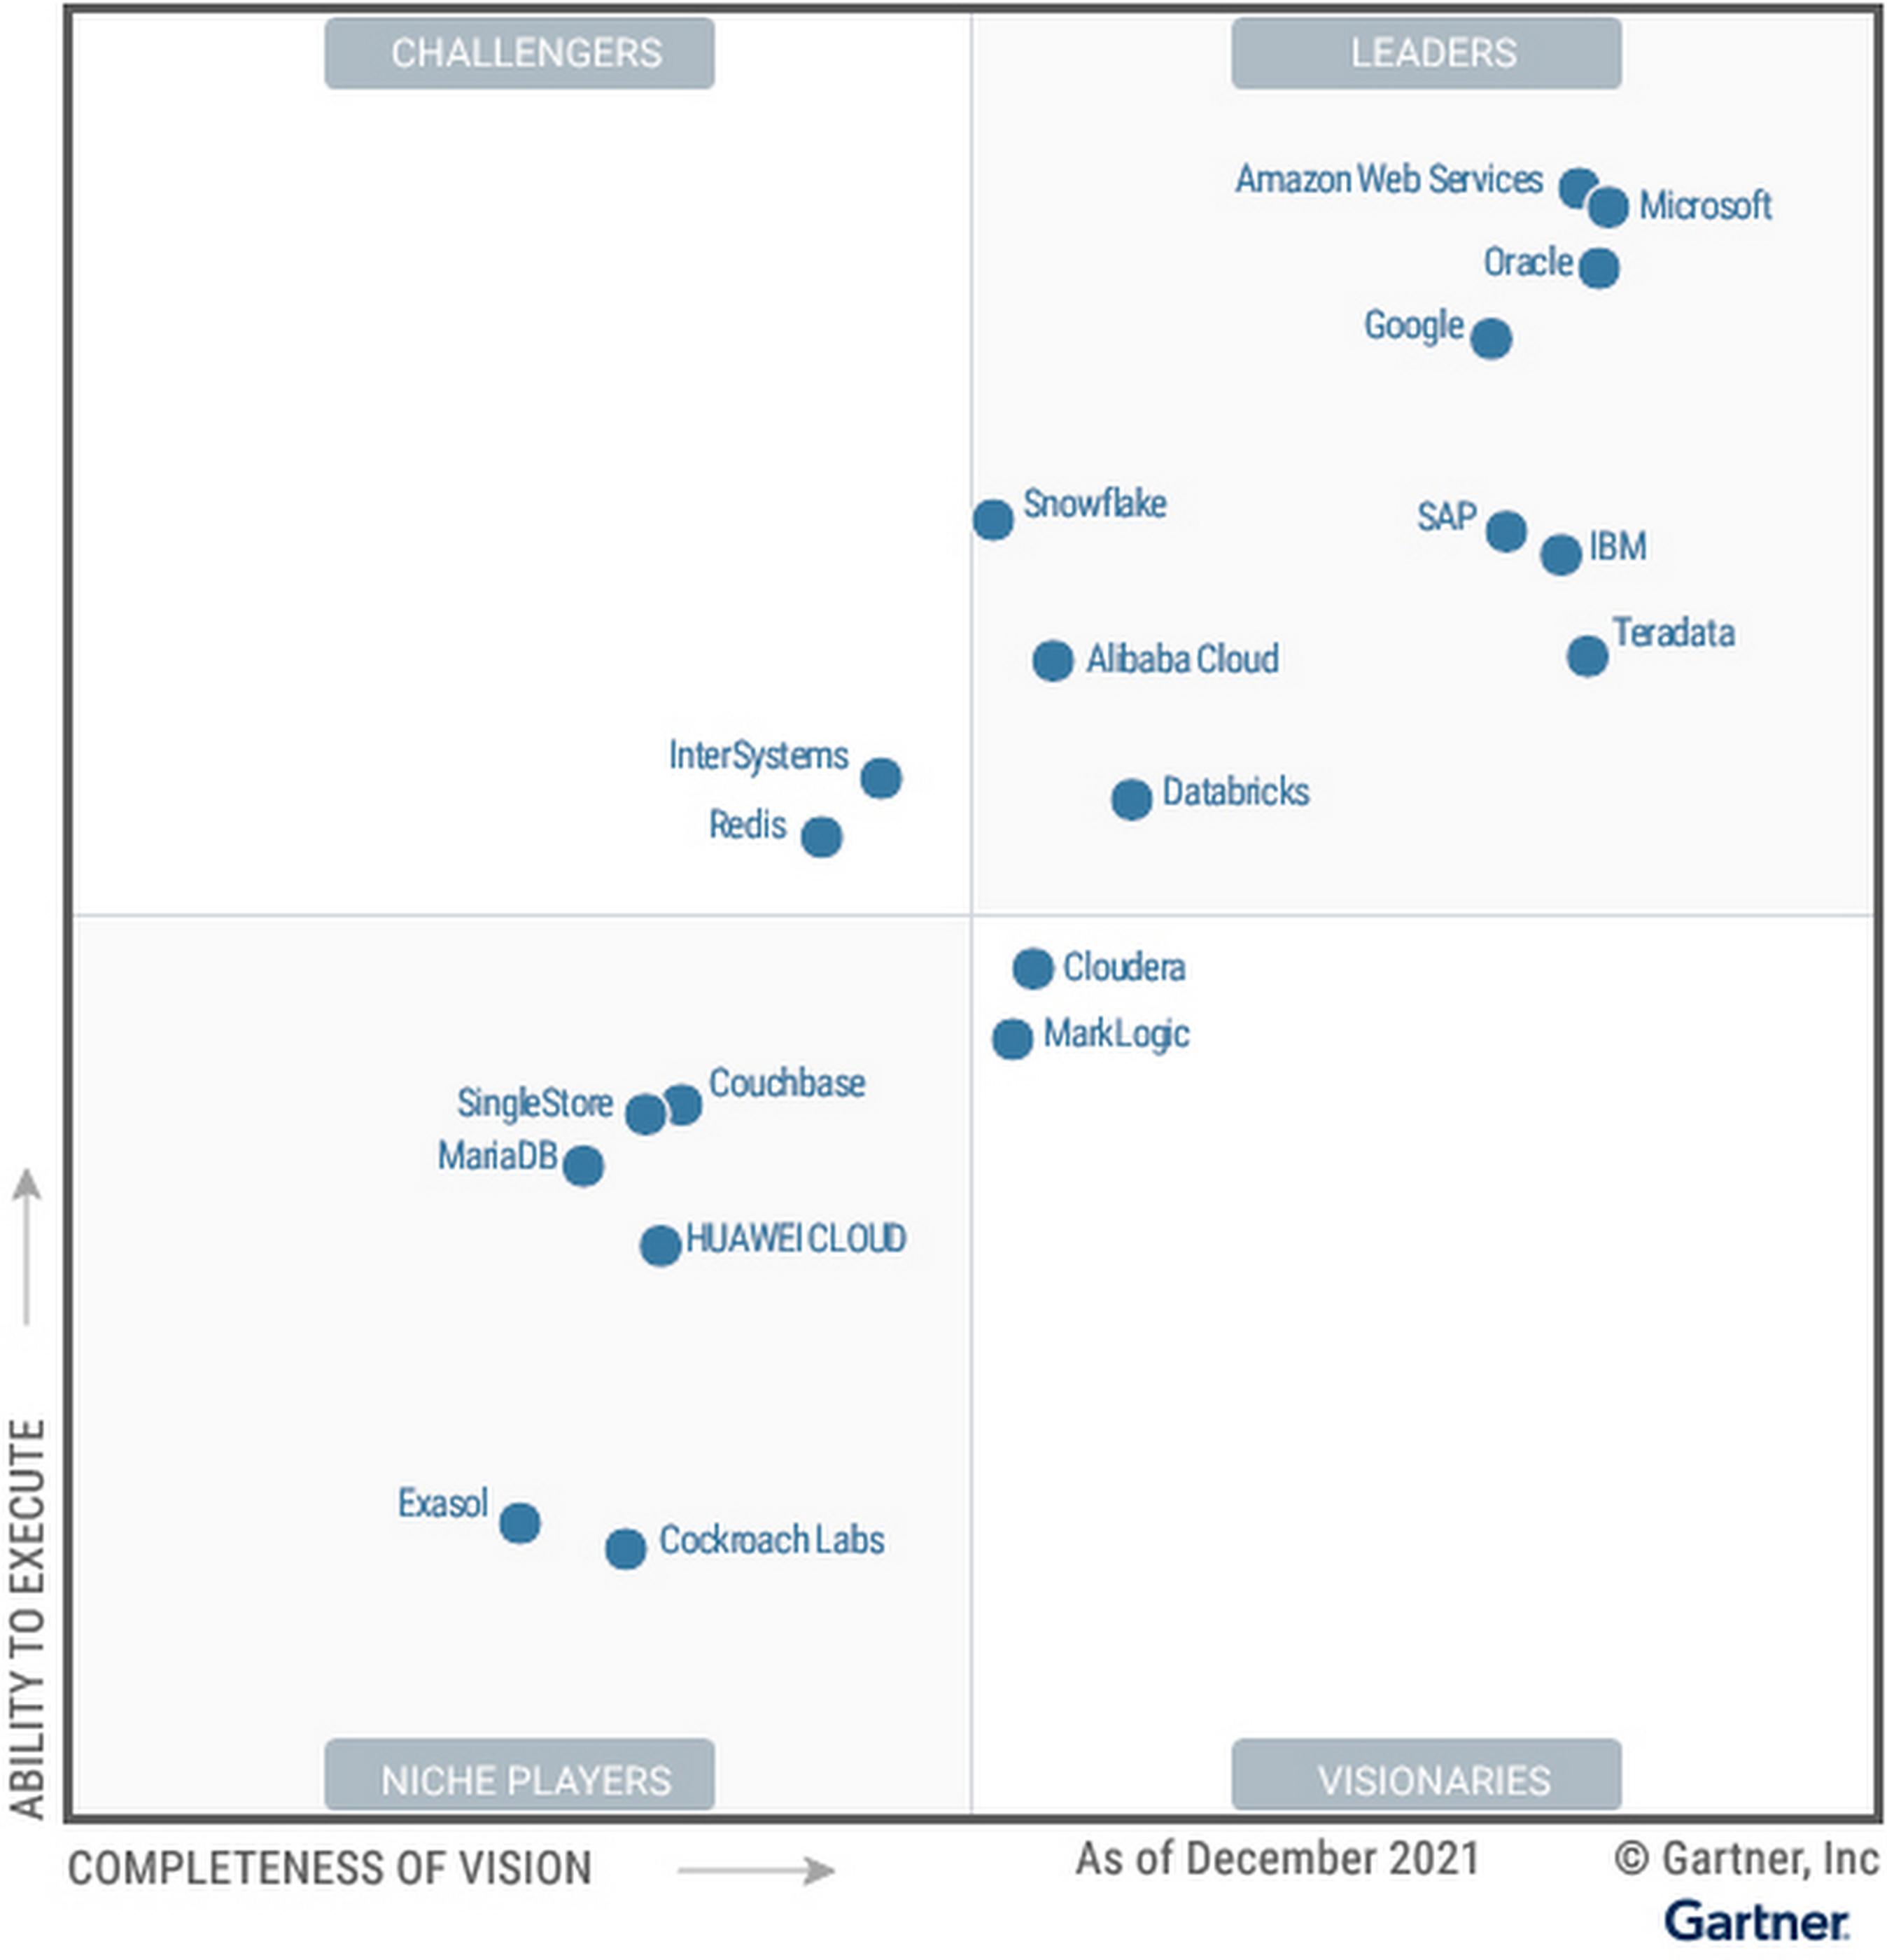
We believe the report evaluated Google’s unified capabilities across both transactional and analytical use cases, and showcases innovation progress in areas like data management consistency, high speed processing and ingestion, security, elasticity, advanced analytics, and more.
With the recent announcement of Dataplex, organizations can centrally manage, monitor, and govern their data across data lakes, data warehouses, and data marts with consistent controls. Solutions like BigQuery ML provide a “built-in” approach for advanced analytics capabilities and Analytics Hub offer the infrastructure customers need to share data analytics solutions securely and at scale in ways never before achieved. For example, over a seven-day period in April, more than 3,000 different organizations shared over 200 petabytes of data using BigQuery.
Research shows 90% of organizations have a multicloud strategy, which is why we have invested in a cross-cloud data analytics solution for Google Cloud, AWS, and Azure with BigQuery Omni. Additionally, our progress with Anthos and our Distributed Cloud this past year further advance our ability to support multi and hybrid cloud scenarios. To gain a competitive advantage using data, organizations need a data platform that transcends transactional and analytical workloads and can be run with the highest level of reliability, availability and security. Cloud Spanner, our globally distributed relational database has redefined the scale, global consistency, and availability of Online Transaction Processing (OLTP) systems. Spanner processes over 1 billion requests per second at peak, and has been battle-tested with some of the most-demanding applications, including Google services such as Search, YouTube, Gmail, Maps, and Payments. And what’s unique about our core services Spanner and BigQuery, is that they leverage common infrastructure such as our highly durable distributed file system (Colossus), our large-scale cluster management system (Borg), and Jupiter, our high-performance networking infrastructure, enabling features such as federation between Spanner and BigQuery.
We remain focused on the integration of Google Trends, Maps, Search, Ads, and have increased industry domain expertise in areas such as retail, financial services, healthcare, and gaming. We’re continuing to develop industry white papers such as this one – How to develop Global Multiplayer Games using Cloud Spanner – and we’re proud of the work the team has done to create and share industry and horizontal architecture patterns built from industry leaders to serve as solution accelerators for customer use cases.
Innovation momentum continues with a unified and open data cloud
We continue to innovate across our data cloud portfolio, especially with the innovations we announced at Google Cloud NEXT’21. BigQuery Omni is now available for AWS and Azure, supporting cross-cloud analytics for customers. We’ve added additional capabilities for enterprise data management and governance with Dataplex, which recently went GA. We’ve made migrations to Cloud SQL easier and faster with the Database Migration Service. More than 85% of all migrations are underway in under an hour, with the majority of customers migrating their databases from other clouds. We are embracing openness with Spanner by adding a PostgreSQL interface, allowing enterprises to take advantage of Spanner’s unmatched global scale, 99.999% availability, and strong consistency using skills and tools from the popular PostgreSQL ecosystem. We are also automating data processing with Spark on Google Cloud, which enables developers to spend less time on infrastructure management and more time on data science, modeling, and delivering business value. Finally, we announced Google Earth Engine on Google Cloud, allowing customers to integrate Earth Engine with BigQuery, Google Cloud’s ML technologies, and the Google Maps Platform.
With these innovations, enterprises like PayPal, Deutsche Bank, and Equifax use Google Cloud to solve for their end-to-end data lifecycle use cases. Organizations like Telefonica use Google Cloud to deliver new customer experiences. Telefónica has transformed every aspect of how they store, share, and analyze data while doubling processing power and lowering costs.
We continue to support an open ecosystem of data partners including Informatica, Tableau, MongoDB, Neo4j, C3.ai, and Databricks, giving customers the flexibility of choice to build their data clouds without being locked into a single approach.
We are honored to be a Leader in the 2021 Gartner Magic Quadrant for Cloud Database Management Systems (DBMS), and look forward to continuing to innovate and partner with you on your digital transformation journey.
Download the complimentary 2021 Gartner Magic Quadrant for Cloud Database Management Systems report.
Learn more about how organizations are building their data clouds with Google Cloud solutions.
Gartner, Magic Quadrant for Cloud Database Management Systems, Henry Cook, Merv Adrian, Rick Greenwald, Adam Ronthal, Philip Russom, 14 December 2021.
Gartner and Magic Quadrant are registered trademarks of Gartner, Inc. and/or its affiliates in the U.S. and internationally and are used herein with permission. All rights reserved.
Gartner does not endorse any vendor, product or service depicted in its research publications and does not advise technology users to select only those vendors with the highest ratings or other designation. Gartner research publications consist of the opinions of Gartner’s Research & Advisory organization and should not be construed as statements of fact. Gartner disclaims all warranties, expressed or implied, with respect to this research, including any warranties of merchantability or fitness for a particular purpose.
This graphic was published by Gartner, Inc. as part of a larger research document and should be evaluated in the context of the entire document. The Gartner document is available upon request from Google Cloud.
4033
Of your peers have already watched this video.
54:30 Minutes
The most insightful time you'll spend today!
Quick Tips to Get the Most Out of Cloud Spanner
Today, IT Admins and DBAs are inundated with thankless tasks. But they no longer have to deal with that. With Cloud Spanner, they can focus on value-add and innovation instead of maintenance. Creating or scaling a globally replicated database for mission-critical apps now takes a handful of clicks.
Industry-leading high-availability and Google-grade security as defaults, not expensive add-ons, help ensure your apps stay online and more secure.
Cloud Spanner is a powerful product, but many users do not maximize its benefits.
It is the first scalable, enterprise-grade, globally-distributed, and strongly consistent database service built for the cloud specifically to combine the benefits of relational database structure with a non-relational horizontal scale.
This combination delivers high-performance transactions and strong consistency across rows, regions, and continents with an industry-leading 99.999% availability SLA, no planned downtime, and enterprise-grade security. Cloud Spanner revolutionizes database administration and management and makes application development more efficient.
This video highlights best practices, strategies for optimizing applications and workloads, and ways to improve performance and scalability. This live demos shows real-time speed-ups of transactions, queries, and overall performance.
Additionally, this talk explores techniques for monitoring Cloud Spanner to identify performance bottlenecks. Watch now to learn more.
Lending DocAI Shortens Borrowers’ Journey on Roostify

11836
Of your peers have already read this article.
3:00 Minutes
The most insightful time you'll spend today!
The home lending journey entails processing an immense number of documents daily from hundreds of thousands of borrowers. Currently, home lending document processing relies on some outdated digital models and a high dependency on manual labor, resulting in slow processing times and higher origination costs. Scaling a business that sorts through millions of documents daily, while increasing efficacy and accuracy, is no small feat. When it comes to applying for a mortgage loan, consumers expect a digital experience that’s as good as the in-person one. Roostify simplifies the home lending journey for lenders and their customers.
No time to spare: Overcoming document processing challenges with AI
Roostify provides enterprise cloud applications for mortgage and home lenders. In order to empower its customers to deliver a better, more personalized lending experience, they needed to automate and scale their in-house document parsing functionality.
As a key component of its document intelligence service, Roostify is leveraging Google Cloud’s Lending DocAI machine learning platform to automate processing documents required during a home loan application process, such as tax returns or bank statements with multi-language support. This partnership delivers data capture at scale, enabling Roostify customers to automatically identify document types from the uploaded file and to extract relevant entities such as wages, tax liabilities, names, and ID numbers for further processing, and make things move faster in the cumbersome lending process.
Roostify’s solutions leverage Google Cloud’s Lending DocAI, which is built on the recently announced Document AI platform, a unified console for document processing. Customers can easily create and customize all the specialized parsers (e.g., mortgage lending documents and tax returns parsers) on the platform without the need to perform additional data mapping or training. All Google Cloud’s specialized parsers are fine-tuned to achieve industry-leading accuracy, helping customers and partners confidently unlock insights from documents with machine learning. Learn more about the solution from the GA launch blog and the overview video.
Integrating Lending DocAI’s intelligent document processing capabilities into the Roostify platform means more innovation for their customers and tangible results: faster loan processing times, fewer document intake errors, and lower origination costs. Additional support in Google Lending DAI for other languages and more documents like global Know Your Customer (KYC) documents or payroll reports is in the near future.
Full integration of AI solutions
Working together with Roostify’s platform team, we were able to help them solve their document processing challenge through integration of various GCP products such as Lending DocAI (LDAI), Data Loss Prevention (DLP) for redacting sensitive data, BigQuery for data warehousing and analytics, and Firestore for API status. To make it very safe and secure, all data was encrypted end-to-end at Rest and in Transit. LDAI won’t require any training data to process. It is an easy plug and play API.
Here is a sneak peek in the high level deployment architecture for LDAI in Roostify environment:

Here are the steps for processing data:
- Receives document processing request from the client.
- API Function directs requests to the pre-processing service. For Async requests a processing ID is generated and returned to the caller.
- Pre-processing service sends the request for further processing (Long/short PDF conversion), calling other microservices and receives back the responses. Any error in the response received is then sent to the response processing service.
- If the response is synchronous, the pre-processing service directs it to the LDAI Invoker service.
- If the response is asynchronous, the pre-processing service feeds it into the Cloud Pub/Sub service.
- Cloud Pub/Sub service feeds the response back to the LDAI Invoker service.
- LDAI Invoker service routes the request to the Google LDAI API for classification if there are multiple pages in the document.
- Document will be split based on LDAI response and then saved in a GCS bucket for temporary storage.
- LDAI entity interface for single page processing and then LDAI Invoker sends LDAI results to LDAI Response Processing
- If a request is a synchronous request the LDAI Response Processor sends results to the API Function so that it can complete the synchronous call and respond to the rConnect caller.
- If the request is an asynchronous request the LDAI Response Processor will respond to the caller’s webhook and complete the transaction.
- Finally, Data stored in the GCP bucket will be deleted.
All the responses that come from the LDAI API can optionally feed into BigQuery via the Response Processor, after parsing it through Data Loss Prevention (DLP) API to redact the PII/sensitive information. Throughout the processing of both asynchronous and synchronous requests all transactions are logged using Cloud Logging. For asynchronous transactions, the state is maintained throughout the process using Cloud Firestore.
Roostify currently uses this technology to power two different solutions: Roostify Document Intelligence and Roostify Beyond™. Roostify Document Intelligence is a real-time document capture, classification, and data extraction solution built for home lenders. It ingests documents uploaded by borrowers and loan officers, identifies the relevant documents, and extracts and classifies key information. Roostify Document Intelligence is available as a standalone API service to any home lender with any digital lending infrastructure already in place.
Roostify Beyond™ is a robust suite of AI-powered solutions that enables home lenders to create intelligent experiences from start to close. It combines powerful data, insightful analytics, and meaningful visualization to streamline the underwriting process. Roostify Beyond™ is currently available only to Roostify customers as part of an Early Adopter program and will be rolled out to the market later this year.


Through this partnership, Roostify has enabled its customers to adopt a data-first approach to their home lending processes, which will lead to improved user experiences and significantly reduced loan processing times.
Fast track end-to-end deployment with Google Cloud AI Services (AIS)
Google AIS (Professional Services Organization), in collaboration with our partner Quantiphi, helped Roostify deploy this system into production and fast-tracked the development multifold to generate the final business value.
The partnership between Google Cloud and Roostify is just one of the latest examples of how we’re providing AI-powered solutions to solve business problems.
5053
Of your peers have already watched this video.
21:00 Minutes
The most insightful time you'll spend today!
Uber’s Story of Scaling Their App with Millions of Concurrent Requests
Uber has millions of concurrent customers who use the platform to book rides and place food delivery orders, generating billions of database transactions per day. In just a click of a button, Uber captures users’ intent which bases their fulfillment model to meet the customers’ demand, and match it to active providers that address their demand with supply.
Uber’s fulfillment platform capability is the lifeline powering every line of business and also allows rapid scaling of new verticals. Hundreds of microservices at Uber depend on this fulfillment platform as a source of truth for all their active booking, delivery or order session. The events generated by this platform are used by hundreds of offline data sets to power business decisions. Additionally over hundreds of developers at Uber extend the platform with APIs, events and codes to build 120+ unique fulfillment flows!
Watch the video to learn about Uber’s decision to move from on-prem to Google Cloud’s Cloud Spanner while still taking live orders at scale and meeting customers’ expectations.
BigQuery Explainable AI for Demystifying the Inner Workings of ML Models. Now GA!

6575
Of your peers have already read this article.
2:00 Minutes
The most insightful time you'll spend today!
Explainable AI (XAI) helps you understand and interpret how your machine learning models make decisions. We’re excited to announce that BigQuery Explainable AI is now generally available (GA). BigQuery is the data warehouse that supports explainable AI in a most comprehensive way w.r.t both XAI methodology and model types. It does this at BigQuery scale, enabling millions of explanations within seconds with a single SQL query.
Why is Explainable AI so important? To demystify the inner workings of machine learning models, Explainable AI is quickly becoming an essential and growing need for businesses as they continue to invest in AI and ML. With 76% of enterprises now prioritizing artificial intelligence (AI) and machine learning (ML) over other initiatives in 2021 IT budgets, the majority of CEOs (82%) believe that AI-based decisions must be explainable to be trusted according to a PwC survey.
While the focus of this blogpost is on BigQuery Explainable AI, Google Cloud provides a variety of tools and frameworks to help you interpret models outside of BigQuery, such as with Vertex Explainable AI, which includes AutoML Tables, AutoML Vision, and custom-trained models.
So how does Explainable AI in BigQuery work exactly? And how might you use it in practice?
Two types of Explainable AI: global and local explainability
When it comes to Explainable AI, the first thing to note is that there are two main types of explainability as they relate to the features used to train the ML model: global explainability and local explainability.
Imagine that you have a ML model that predicts housing price (as a dollar amount), based on three features: (1) number of bedrooms, (2) distance to the nearest city center, and (3) construction date.
Global explainability (a.k.a. global feature importance) describes the features’ overall influence on the model and helps you understand if a feature had a greater influence than other features over the model’s predictions. For example, global explainability can reveal that the number of bedrooms and distance to city center typically has a much stronger influence than the construction date on predicting housing prices. Global explainability is especially useful if you have hundreds or thousands of features and you want to determine which features are the most important contributors to your model. You may also consider using global explainability as a way to identify and prune less important features to improve the generalizability of their models.
Local explainability (a.k.a. feature attributions) describes the breakdown of how each feature contributes towards a specific prediction. For example, if the model predicts that house ID#1001 has a predicted price of $230,000, local explainability would describe a baseline amount (e.g. $50,000) and how each of the features contributes on top of the baseline towards the predicted price. For example, the model may say that on top of the baseline of $50,000, having 3 bedrooms contributed an additional $50,000, close proximity to the city center added $100,000, and construction date of 2010 added $30,000, for a total predicted price of $230,000. In essence, understanding the exact contribution of each feature used by the model to make each prediction is the main purpose of local explainability.
What ML models does BigQuery Explainable AI apply to?
BigQuery Explainable AI applies to a variety of models, including supervised learning models for IID data and time series models. The documentation for BigQuery Explainable AI provides an overview of the different ways of applying explainability per model. Note that each explainability method has its own way of calculation (e.g. Shapley values), which are covered more in-depth in the documentation.

Examples with BigQuery Explainable AI
In this next section, we will show three examples of how to use BigQuery Explainable AI in different ML applications:
Regression models with BigQuery Explainable AI
Let’s use a boosted tree regression model to predict how much a taxi cab driver will receive in tips for a taxi ride, based on features such as number of passengers, payment type, total payment and trip distance. Then let’s use BigQuery Explainable AI to help us understand how the model made the predictions in terms of global explainability (which features were most important?) and local explainability (how did the model arrive at each prediction?).
The taxi trips dataset comes from the BigQuery public datasets and is publicly available in the table: bigquery-public-data.new_york_taxi_trips.tlc_yellow_trips_2018.
First, you can train a boosted tree regression model.
CREATE OR REPLACE MODEL bqml_tutorial.taxi_tip_regression_modelOPTIONS (model_type='boosted_tree_regressor',input_label_cols=['tip_amount'],max_iterations = 50,tree_method = 'HIST',subsample = 0.85,enable_global_explain = TRUE) ASSELECTvendor_id,passenger_count,trip_distance,rate_code,payment_type,total_amount,tip_amountFROM`bigquery-public-data.new_york_taxi_trips.tlc_yellow_trips_2018`WHERE tip_amount >= 0LIMIT 1000000
Now let’s do a prediction using ML.PREDICT, which is the standard way in BigQuery ML to make predictions without explainability.
SELECT *FROMML.PREDICT(MODEL bqml_tutorial.taxi_tip_regression_model,(SELECT"0" AS vendor_id,1 AS passenger_count,CAST(5.85 AS NUMERIC) AS trip_distance,"0" AS rate_code,"0" AS payment_type,CAST(55.56 AS NUMERIC) AS total_amount))

But you might wonder—how did the model generate this prediction of ~11.077?
BigQuery Explainable AI can help us answer this question. Instead of using ML.PREDICT, you use ML.EXPLAIN_PREDICT with an additional optional parameter top_k_features. ML.EXPLAIN_PREDICT extends the capabilities of ML.PREDICT by outputting several additional columns that explain how each feature contributes to the predicted value. In fact, since ML.EXPLAIN_PREDICT includes all the output from ML.PREDICT anyway, you may want to consider using ML.EXPLAIN_PREDICT every time instead.
SELECT *FROMML.EXPLAIN_PREDICT(MODEL bqml_tutorial.taxi_tip_regression_model,(SELECT"0" AS vendor_id,1 AS passenger_count,CAST(5.85 AS NUMERIC) AS trip_distance,"0" AS rate_code,"0" AS payment_type,CAST(55.56 AS NUMERIC) AS total_amount),STRUCT(6 AS top_k_features))

The way to interpret these columns is:
Σfeature_attributions + baseline_prediction_value = prediction_value
Let’s break this down. The prediction_value is ~11.077, which is simply the predicted_tip_amount. The baseline_prediction_value is ~6.184, which is the tip amount for an average instance. top_feature_attributions indicates how much each of the features contributes towards the prediction value. For example, total_amount contributes ~2.540 to the predicted_tip_amount.
ML.EXPLAIN_PREDICT provides local feature explainability for regression models. For global feature importance, see the documentation for ML.GLOBAL_EXPLAIN.
Classification models with BigQuery Explainable AI
Let’s use a logistic regression model to show you an example of BigQuery Explainable AI with classification models. We can use the same public dataset as before: bigquery-public-data.new_york_taxi_trips.tlc_yellow_trips_2018.
Train a logistic regression model to predict the bracket of the percentage of the tip amount out of the taxi bill.
CREATE OR REPLACE MODEL bqml_tutorial.taxi_tip_classification_modelOPTIONS(model_type='logistic_reg',input_label_cols=['tip_bucket'],enable_global_explain=true) ASSELECTvendor_id,passenger_count,trip_distance,rate_code,payment_type,total_amount,CASEWHEN tip_amount > total_amount*0.20 THEN '20% or more'WHEN tip_amount > total_amount*0.15 THEN '15% to 20%'WHEN tip_amount > total_amount*0.10 THEN '10% to 15%'ELSE '10% or less'END AS tip_bucketFROM`bigquery-public-data.new_york_taxi_trips.tlc_yellow_trips_2018`WHERE tip_amount >= 0LIMIT 1000000
Next, you can run ML.EXPLAIN_PREDICT to get both the classification results and the additional information for local feature explainability. For global explainability, you can use ML.GLOBAL_EXPLAIN. Again, since ML.EXPLAIN_PREDICT includes all the output from ML.PREDICT anyway, you may want to consider using ML.EXPLAIN_PREDICT every time instead.
SELECT *FROMML.EXPLAIN_PREDICT(MODEL bqml_tutorial.taxi_tip_classification_model,(SELECT"0" AS vendor_id,1 AS passenger_count,CAST(5.85 AS NUMERIC) AS trip_distance,"0" AS rate_code,"0" AS payment_type,CAST(55.56 AS NUMERIC) AS total_amount),STRUCT(6 AS top_k_features))

Similar to the regression example earlier, the formula is used to derive the prediction_value:
Σfeature_attributions + baseline_prediction_value = prediction_value
As you can see in the screenshot above, the baseline_prediction_value is ~0.296. total_amount is the most important feature in making this specific prediction, contributing ~0.067 to the prediction_value, though followed by trip_distance. The feature passenger_count contributes negatively to prediction_value by -0.0015. The features vendor_id, rate_code, and payment_type did not seem to contribute much to the prediction_value.
You may wonder why the prediction_value of ~0.389 doesn’t equal the probability value of ~0.359. The reason is that unlike for regression models, for classification models, prediction_value is not a probability score. Instead, prediction_value is the logit value (i.e., log-odds) for the predicted class, which you could separately convert to probabilities by applying the softmax transformation to the logit values. For example, a three-class classification has a log-odds output of [2.446, -2.021, -2.190]. After applying the softmax transformation, the probability of these class predictions is [0.9905, 0.0056, 0.0038].
Time-series forecasting models with BigQuery Explainable AI

Explainable AI for forecasting provides more interpretability into how the forecasting model came to its predictions. Let’s go through an example of forecasting the number of bike trips in NYC using the new_york.citibike_trips public data in BigQuery.
You can train a time-series model ARIMA_PLUS:
CREATE OR REPLACE MODEL bqml_tutorial.nyc_citibike_arima_modelOPTIONS(model_type = 'ARIMA_PLUS',time_series_timestamp_col = 'date',time_series_data_col = 'num_trips',holiday_region = 'US') ASSELECTEXTRACT(DATE from starttime) AS date,COUNT(*) AS num_tripsFROM`bigquery-public-data.new_york.citibike_trips`GROUP BY dateNext, you can first try forecasting without explainability using ML.FORECAST:SELECT*FROMML.FORECAST(MODEL bqml_tutorial.nyc_citibike_arima_model,STRUCT(365 AS horizon, 0.9 AS confidence_level))
This function outputs the forecasted values and the prediction interval. Plotting it in addition to the input time series gives the following figure.

But how does the forecasting model arrive at its predictions? Explainability is especially important if the model ever generates unexpected results.
With ML.EXPLAIN_FORECAST, BigQuery Explainable AI provides extra transparency into the seasonality, trend, holiday effects, level (step) changes, and spikes and dips outlier removal. In fact, since ML.EXPLAIN_FORECAST includes all the output from ML.FORECAST anyway, you may want to consider using ML.EXPLAIN_FORECAST every time instead.
SELECT*FROMML.EXPLAIN_FORECAST(MODEL bqml_tutorial.nyc_citibike_arima_model,STRUCT(365 AS horizon, 0.9 AS confidence_level))

Compared to the previous figure which only shows the forecasting results, this figure shows much richer information to explain how the forecast is made.
First, it shows how the input time series is adjusted by removing the spikes and dips anomalies, and by compensating the level changes. That is:
time_series_adjusted_data = time_series_data - spikes_and_dips - step_changes
Second, it shows how the adjusted input time series is decomposed into different components such as both weekly and yearly seasonal components, holiday effect component and trend component. That is
time_series_adjusted_data = trend + seasonal_period_yearly + seasonal_period_weekly + holiday_effect + residual
Finally, it shows how these components are forecasted separately to compose the final forecasting results. That is:
time_series_data = trend + seasonal_period_yearly + seasonal_period_weekly + holiday_effect
For more information on these time series components, please see the documentation here.
Conclusion
With the GA of BigQuery Explainable AI, we hope you will now be able to interpret your machine learning models with ease.
Thanks to the BigQuery ML team, especially Lisa Yin, Jiashang Liu, Amir Hormati, Mingge Deng, Jerry Ye and Abhinav Khushraj. Also thanks to the Vertex Explainable AI team, especially David Pitman and Besim Avci.
More Relevant Stories for Your Company

Why and How to Migrate to Google BigQuery
Over the past few decades, organizations have mastered the science of data warehousing. They have increasingly applied descriptive analytics to large quantities of stored data, gaining insight into their core business operations. Conventional Business Intelligence (BI), which focuses on querying, reporting, and Online Analytical Processing, might have been a differentiating factor

ActivStat: Enhancing Live Sports Broadcast with Real-time Stats and Metrics
Millions of people annually view esports, as top players and teams compete in thrilling, fast-paced tests of reflexes, strategy, and teamwork. Fans are a diverse group, sharing a passion for action. A new, revolutionary project we’re working on with Call of Duty League just made that action a lot better.

What is Google Cloud SQL?
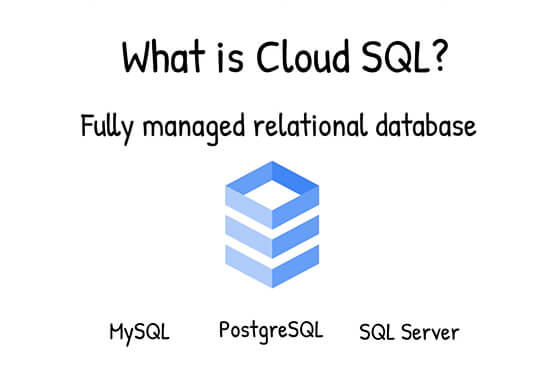
Cloud SQL is a fully managed relational database for MySQL, PostgreSQL, and SQL Server. It reduces maintenance cost and automates database provisioning, storage capacity management, replication, and backups. It offers quick setup, with standard connection drivers and built-in migration tools. How Do You Set It Up? Cloud SQL is easy

The Right Datawarehouse Helps Fight Climate Change, While Improving Customer Experience
When you think about climate change, you might not consider a daily commute to work or a drive around town as big contributing factors. And yet, transport is the fastest growing source of CO2 emissions from fossil fuel, which in turn is the largest contributor to climate change. This is the key insight
