





Making Streaming Analytics Simpler and More Cost-Effective With Cloud Dataflow

3890
Of your peers have already read this article.
8:30 Minutes
The most insightful time you'll spend today!
Streaming analytics helps businesses to understand their customers in real time and adjust their offerings and actions to better serve customer needs. It’s an important part of modern data analytics, and can open up possibilities for faster decisions.
For streaming analytics projects to be successful, the tools have to be easy to use, familiar, and cost-effective. Since its launch in 2015, Cloud Dataflow, Google’s fully managed streaming analytics service, has been known for its powerful API available in Java and Python. Businesses have almost unlimited customization capabilities for their streaming pipelines when they use these two languages, but these capabilities come at the cost of needing programming skills that are sometimes hard to find.
To advance Google Cloud’s streaming analytics further, Google Cloud is announcing new features available in the public preview for Cloud Dataflow SQL, as well as the general availability of Cloud Dataflow Flexible Resource Scheduling (FlexRS) for a very cost-effective way of batch processing of events. These new features make streaming analytics easier and more accessible to data engineers, particularly those with database experience.
Here’s more detail about each of these new features:
Cloud Dataflow SQL to create streaming (and batch) pipelines using SQL
We know that SQL is the standard for defining data transformations, and that you want more GUI-based tools for creating pipelines. With that in mind, several months ago we launched a public preview of Cloud Dataflow SQL, an easy way to use SQL queries to develop and run Cloud Dataflow jobs from the BigQuery web UI. Today, we are launching several new features in Cloud Dataflow SQL, including Cloud Storage file support and a visual schema editor.
Cloud Dataflow SQL allows you to join Cloud Pub/Sub streams with BigQuery tables and Cloud Storage files. It also provides several additional features:
- Using Streaming SQL extensions for defining time windows and calculating window-based statistics;
- Integration with Cloud Data Catalog for storing the schema of Cloud Pub/Sub topics and Cloud Storage file sets—a key enabler for using SQL with streaming messages;
- A simple-to-use graphical editor available in the BigQuery web UI. If you are familiar with BigQuery’s SQL editor, you can create Cloud Dataflow SQL jobs.
To switch the BigQuery web UI to Cloud Dataflow SQL editing mode, open the BigQuery web UI, go to More>Query settings and select “Cloud Dataflow” as the query engine.
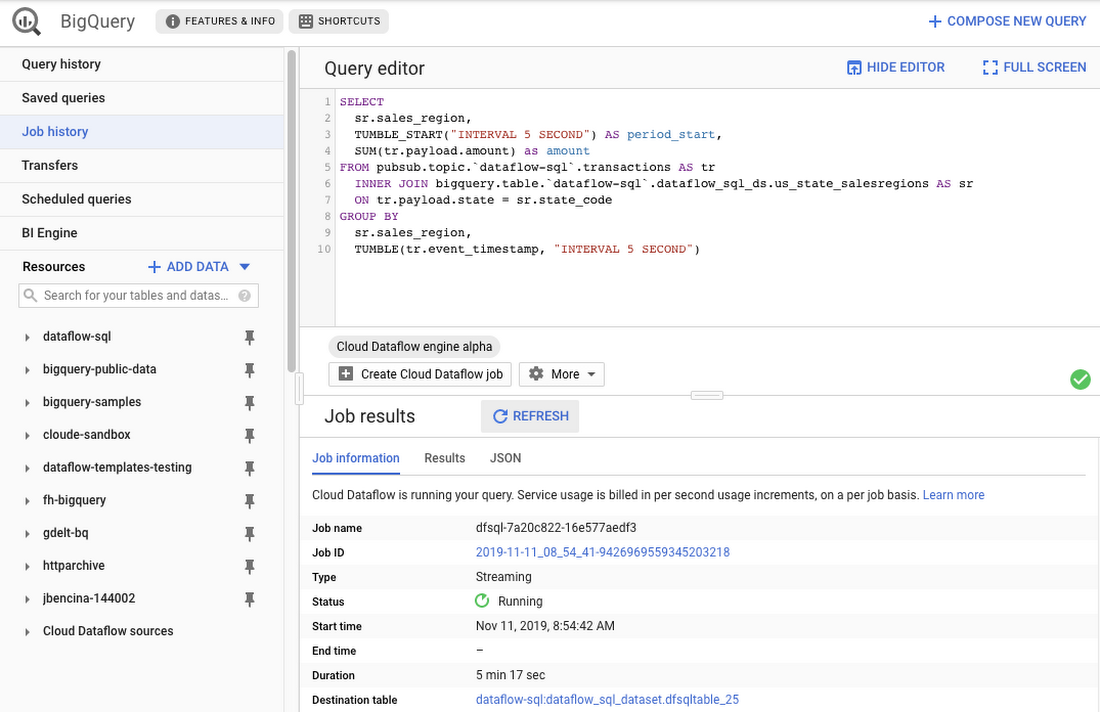
As an example, let’s say you have a Cloud Pub/Sub stream of sales transactions, and you want to build a real-time dashboard for the sales managers of your organization showing them the up-to-date stats of the sales in their regions. You can accomplish this in a few steps: write a SQL statement like the following one, launch a Cloud Dataflow SQL job, direct the output to a BigQuery table, then use one of the many supported dashboarding tools, including Google Sheets, Data Studio, and others, to visualize the results.
SELECTsr.sales_region,TUMBLE_START("INTERVAL 5 SECOND") AS period_start,SUM(tr.payload.amount) as amountFROM pubsub.topic.`dataflow-sql`.transactions AS trINNER JOIN bigquery.table.`dataflow-sql`.dataflow_sql_ds.us_state_salesregions AS srON tr.payload.state = sr.state_codeGROUP BYsr.sales_region,TUMBLE(tr.event_timestamp, "INTERVAL 5 SECOND")
In this example, we are joining the “transactions” Cloud Pub/Sub topic in the “dataflow-sql” project with a metadata table in BigQuery called “us_state_salesregions.” This table contains a mapping between the state codes (present in the “transactions” Cloud Pub/Sub topic) and the sales regions “Region_1”, “Region_2”, .., “Region_N” that are relevant to the sales managers in our example organization. In addition to the join, we’ll do a streaming aggregation of our data, using one of the several windowing functions supported by Cloud Dataflow. In our case, we will use TUMBLE windows, which will divide our stream into fixed five-second time intervals, group all the data in those time windows by the sales_region field, and calculate the sum of sales in the sales region. We also want to preserve the start of each time window, via TUMBLE_START("INTERVAL 5 SECOND"), to plot sales amounts as a time series.
To start a Cloud Dataflow job, click on “Create Cloud Dataflow job” in the BigQuery web UI.
When data starts flowing into the destination table, it will contain three fields: the sales_region, the timestamp of the period start, and the amount of sales.
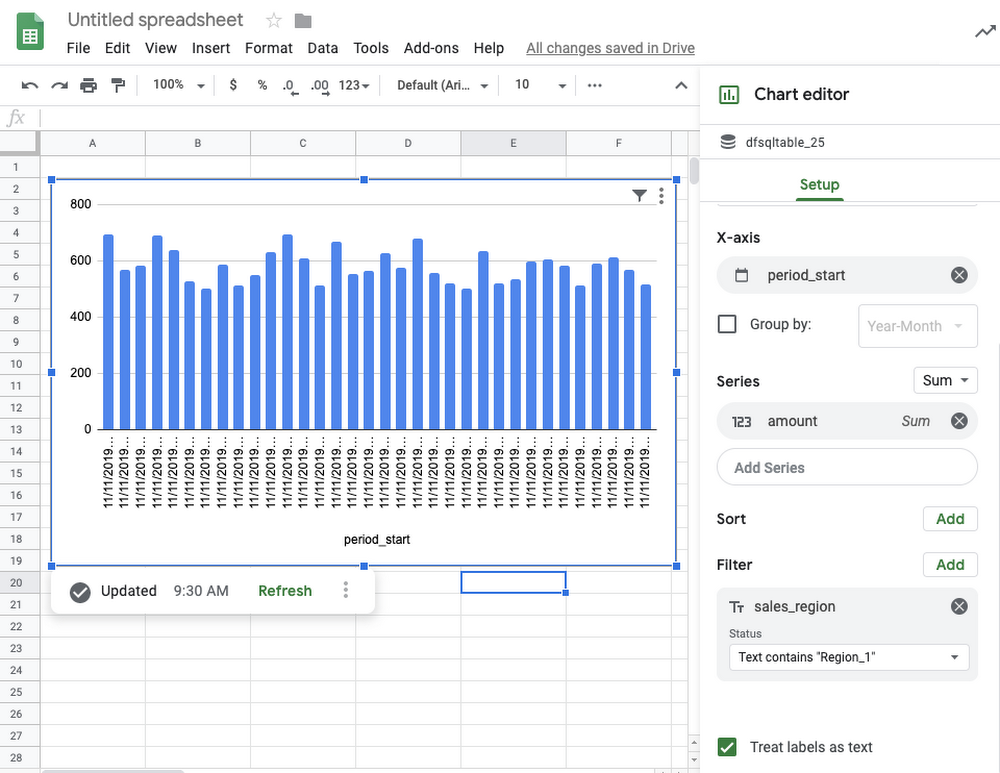
In the next step, we will create a BigQuery Connected Sheet that shows a column chart of sales in “Region_1” over time. Select the destination BigQuery table in the nav tree. In our case, it’s the dfsqltable_25 table.
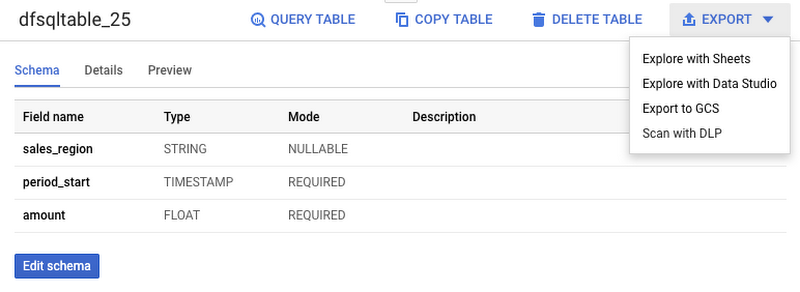
Then, select Export>Explore with Sheets to chart your data. Do it from the tab where your BigQuery table is shown, and not from the tab where your original Cloud Dataflow SQL was. In Sheets, create the column chart using the data connection to BigQuery, and choose period_start for the X-axis, amount as your data series, and add a sales_region filter. This is all you have to do to build a chart in Sheets that visualizes streaming data.
Mixing and joining data in Cloud Pub/Sub and BigQuery helps solve many real-time dashboarding cases, but quite a few customers have also asked for support of their Cloud Storage files to join those files with events in Cloud Pub/Sub or with tables in BigQuery. This is now possible in Dataflow SQL, enabled by our integration with Data Catalog’s Cloud Storage file sets.
In the following example, you’ll see an archive of transactions stored in CSV files in the “transactions_archive” Cloud Storage bucket.
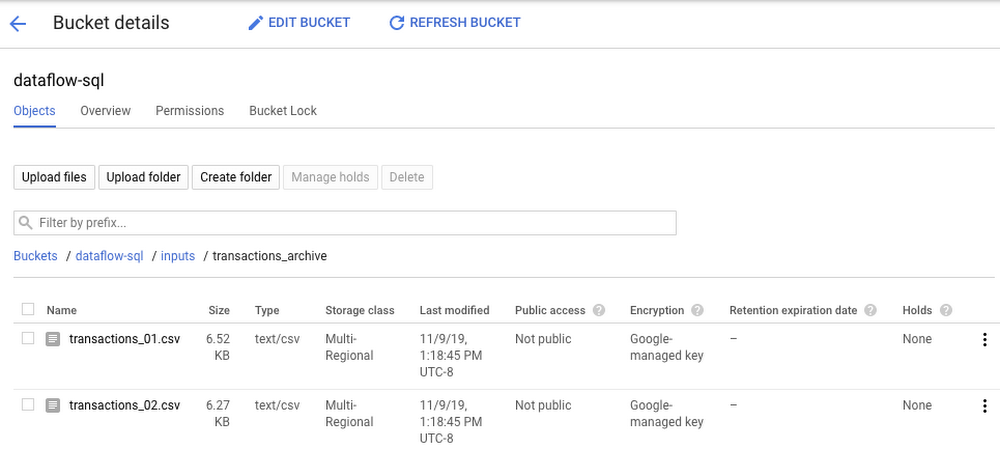
Two gcloud commands can define a Cloud Storage file set and entry group in Data Catalog.
#Create a GCS entrygroupgcloud beta data-catalog entry-groups create transactions_archive_eg --location=us-central1#Create the filesetgcloud beta data-catalog entries create transactions_archive_fs --location=us-central1 --entry-group=transactions_archive_eg --gcs-file-patterns=gs://dataflow-sql/inputs/transactions_archive/*.csv --description="Historical Archive of Transactions"
Notice how we defined the file pattern “gs://dataflow-sql/inputs/transactions_archive/*.csv” as part of the file set entry definition. This pattern is what will allow Cloud Dataflow to find the CSV files once we write the SQL statement that references this file set.
We can even specify the schema of this transactions_archive_fs file set using a GUI editor. For that, go to the BigQuery web UI (make sure it is running in Cloud Dataflow mode), select “Add Data” in the left navigation and choose “Cloud Dataflow sources.” Search for your newly added Cloud Storage file set and add it to your active datasets in the BigQuery UI.
This will allow you to edit the schema of your file set after you select it in the nav tree. The “Edit schema” button is right there on the “Schema” tab. The visual schema editor is new and works for both Cloud Storage file sets as well as for Cloud Pub/Sub topics.
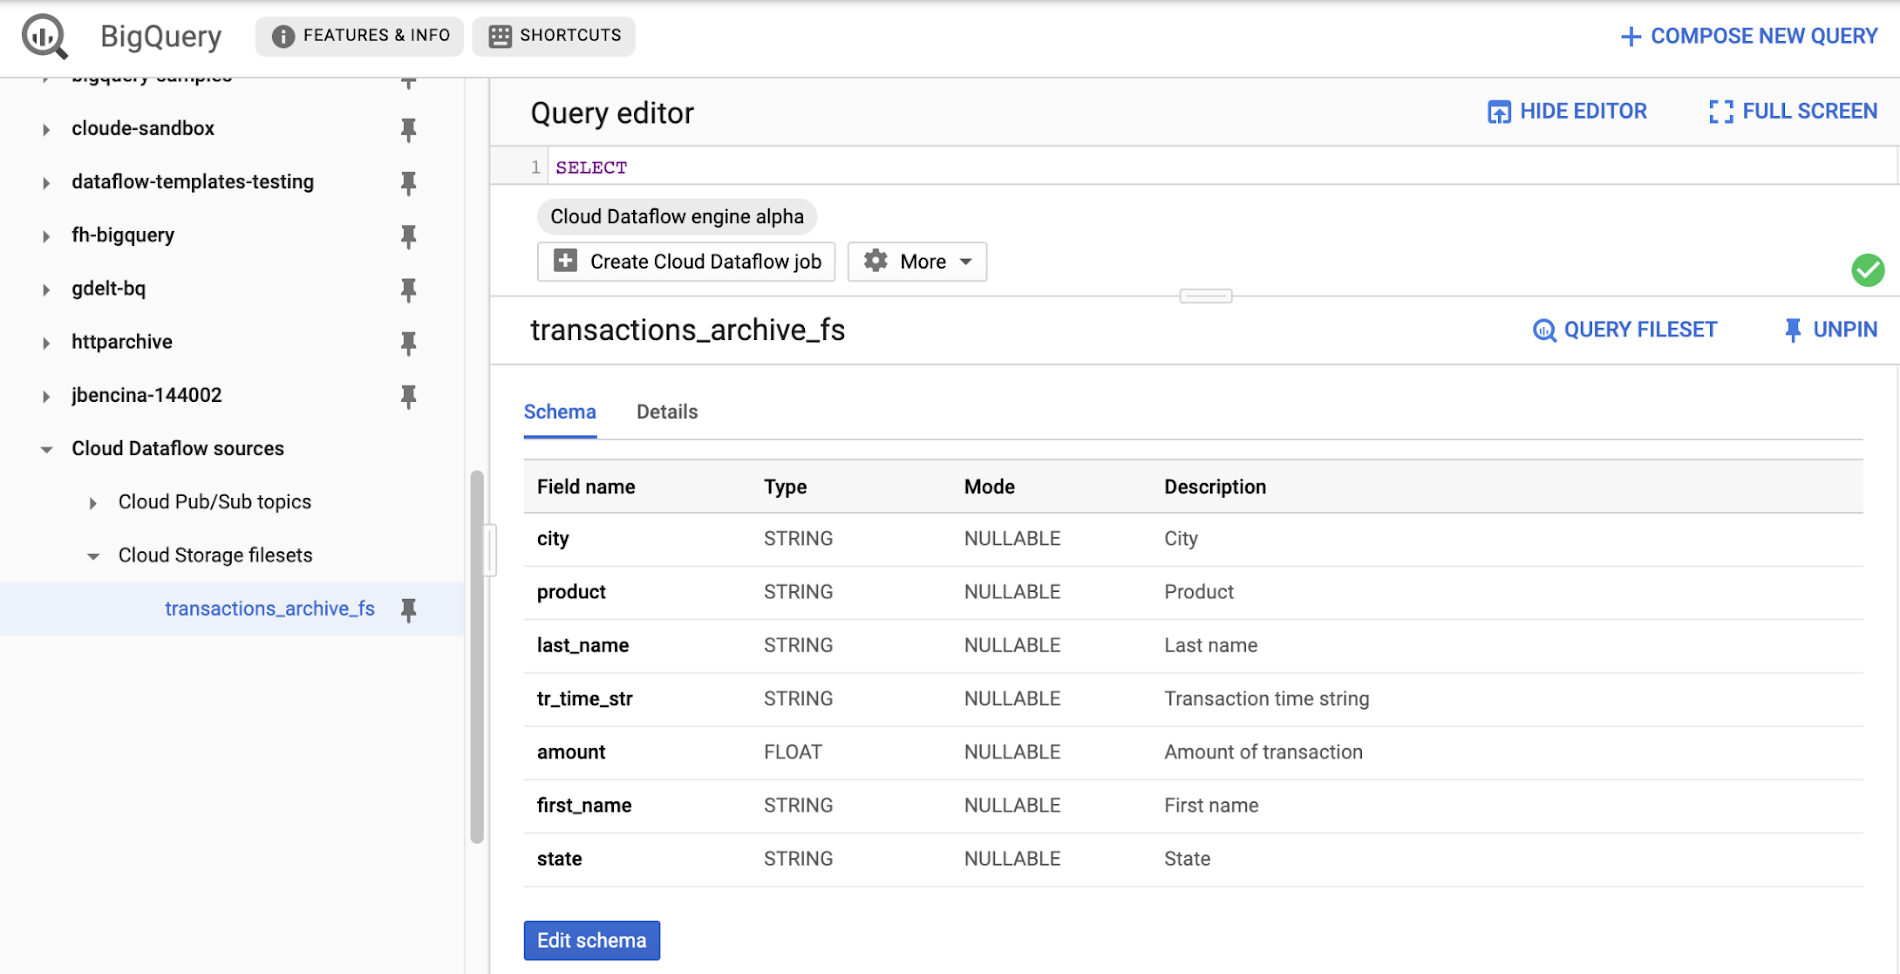
Once you’ve registered the file set in Data Catalog and defined a schema for it, you can query it in Cloud Dataflow SQL. In the next example, we’ll join the transactions archive in Cloud Storage with the metadata mapping table in BigQuery.
SELECTsr.sales_region,TUMBLE_START("INTERVAL 5 SECOND") AS period_start,SUM(tr.amount) as amountFROM datacatalog.entry.`dataflow-sql`.`us-central1`.transactions_archive_eg.transactions_archive_fs AS trINNER JOIN bigquery.table.`dataflow-sql`.dataflow_sql_ds.us_state_salesregions AS srON tr.state = sr.state_codeGROUP BYsr.sales_region,TUMBLE(CAST(tr.tr_time_str AS TIMESTAMP), "INTERVAL 5 SECOND")
Notice how similar this SQL statement is to the one that queries Cloud Pub/Sub. The TUMBLE window function even works on Cloud Storage files, although we will define the windows based on a field “tr_time_str” that is inside the files (the Cloud Pub/Sub SQL statement used the tr.event_timestamp attribute of the Cloud Pub/Sub stream). The only other difference is the reference to the Cloud Storage file set. We accomplish this by specifying datacatalog.entry.`dataflow-sql`.`us-central1`.transactions_archive_eg.transactions_archive_fs AS tr
Because both of the job inputs are bounded (batch) sources, Cloud Dataflow SQL will create a batch job (instead of a streaming job created for the first SQL statement using a Cloud Pub/Sub source) which will join your Cloud Storage files with the BigQuery table, and write the results back to BigQuery.
And now you have both a streaming pipeline feeding your real-time dashboard from a Cloud Pub/Sub topic, as well as a batch pipeline capable of onboarding historical data from CSV files. Check out the SQL Pipelines tutorial to start applying your SQL skills for developing streaming (and batch) Cloud Dataflow pipelines.
FlexRS for cost-effective batch processing of events
While real-time streaming processing is an exciting use case that’s growing rapidly, many streaming practitioners know that every stream processing system needs a sprinkle of batch processing (as you saw in the SQL example). When you bootstrap a streaming pipeline, you usually need to onboard historical data, and this data tends to reside in files stored in Cloud Storage. When streaming events need to be reprocessed due to changes in business logic (i.e., time windows get readjusted, or new fields are added), this reprocessing is also better done in batch mode.
The Apache Beam SDK and the Cloud Dataflow managed service are well-known in the industry for their unified API approach to batch and streaming analytics. The same Cloud Dataflow code can run in either mode with just minimal changes (usually replacing the data source from Cloud Pub/Sub to Cloud Storage). Remember our SQL example, where switching the SQL statement from a streaming source to a batch source was no trouble at all? And while it’s easy to go back and forth between streaming and batch processing in Cloud Dataflow, an important factor influencing the processing choice is cost. Customers who gravitate to batch processing have always looked to find the right balance between the speed of execution and costs. In many cases, that may mean you can be flexible with the amount of time it takes to process a dataset if the overall cost of processing is reduced in a significant fashion.
Our new Cloud Dataflow FlexRS feature reduces batch processing costs by up to 40% using advanced resource scheduling techniques and a mix of different virtual machine (VM) types (including the preemptible VM instances) to decrease processing costs while providing the same job completion guarantees as regular Cloud Dataflow jobs. FlexRS uses the Cloud Dataflow Shuffle service, which allows it to handle the preemption of worker VMs better because the Cloud Dataflow service does not have to redistribute unprocessed data to the remaining workers.
Using FlexRS requires no code changes in your pipeline and can be accomplished by simply specifying the following pipeline parameter:
--flexRSGoal=COST_OPTIMIZED
Running Cloud Dataflow jobs with FlexRS requires autoscaling, a regional endpoint in the intended region, and specific machine types, so you should review the recommendations for other pipeline settings. While Cloud Dataflow SQL does not yet support FlexRS, it will in the future.
Simultaneously with launching FlexRS in general availability, we are also extending its availability to five additional regions, covering all regions now where we have regional endpoints and Cloud Dataflow Shuffle:
- us-central1
- us-east1
- us-west1
- europe-west1
- europe-west4
- asia-east1
- asia-northeast1
To learn more about Cloud Dataflow SQL, check out our tutorial and try creating your SQL pipeline using the BigQuery web UI. Visit our documentation site for additional FlexRS usage and pricing information.
Check out other recently launched streaming and batch processing features:
- We deployed Cloud Dataflow Shuffle and Cloud Dataflow Streaming Engine to three additional regions, bringing total availability to seven regions.
- We launched the ability to protect your pipeline state with customer-managed encryption keys.
Python streaming support from Cloud Dataflow is now generally available.
Four Key Takeaways from Google and Quantum Metric’s Back-to-School Retail Benchmark Study

4789
Of your peers have already read this article.
2:00 Minutes
The most insightful time you'll spend today!
Is it September yet? Hardly! School is barely out for the summer. But according to Google and Quantum Metric research, the back-to-school and off-to-college shopping season – which in the U.S. is second only to the holidays in terms of purchasing volume1 – has already begun. For retailers, that means planning for this peak season has kicked off as well.
We’d like to share four key trends that emerged from Google research and Quantum Metric’s Back-to-School Retail Benchmarks study of U.S. retail data, explore the reasons behind them, and outline the key takeaways.
- Out-of-stock and inflation concerns are changing the way consumers shop. Back-to-school shoppers are starting earlier every year, with 41% beginning even before school is out – even more so when buying for college1. Why? The behavior is driven in large part by consumers’ concerns that they won’t be able to get what they need if they wait too long. 29% of shoppers start looking a full month before they need something1.
Back-to-school purchasing volume is quite high, with the majority spending up to $500 and 21% spending more than $1,0001. In fact, looking at year-over-year data, we see that average cart values have not only doubled since November 2021, but increased since the holidays1. And keep in mind that back-to-school spending is a key indicator leading into the holiday season.
That said, as people are reacting to inflation, they are comparing prices, hunting for bargains, and generally taking more time to plan. This is borne out by the fact that 76% of online shoppers are adding items to their carts and waiting to see if they go on sale before making the purchase1. And, to help stay on budget and reduce shipping costs, 74% plan to make multiple purchases in one checkout1. That carries over to in-store shopping, when consumers are buying more in one visit to reduce trips and save on gas.
2. The omnichannel theme continues. Consumers continue to use multiple channels in their shopping experience. As the pandemic has abated, some 82% expect that their back-to-school buying will be in-store, and 60% plan to purchase online. But in any case, 45% of consumers report that they will use both channels; more than 50% research online first before ever setting foot in a store2. Some use as many as five channels, including video and social media, and these 54% of consumers spend 1.5 times more compared to those who use only two channels4.
And mobile is a big part of the journey. Shoppers are using their phones to make purchases, especially for deadline-driven, last-minute needs, and often check prices on other retailers’ websites while shopping in-store. Anecdotally, mobile is a big part of how we ourselves shop with our children, who like to swipe on the phone through different options for colors and styles. We use our desktops when shopping on our own, especially for items that require research and represent a larger investment – and our study shows that’s quite common.
3. Consumers are making frequent use of wish lists. One trend we have observed is a higher abandonment rate, especially for apparel and general home and school supplies, compared to bigger-ticket items that require more research. But that can be attributed in part to the increasing use of wish lists. Online shoppers are picking a few things that look appealing or items on sale, saving them in wish lists, and then choosing just a few to purchase. Our research shows that 39% of consumers build one or two wish lists per month, while 28% said they build one or two each week, often using their lists to help with budgeting1.
4. Frustration rates have dropped significantly. Abandonment rates aside, shopper annoyance rates are down by 41%, year over year1. This is despite out-of-stock concerns and higher prices. But one key finding showed that both cart abandonment and “rage clicks” are more frequent on desktops, possibly because people investing time on search also have more time to complain to customer service.
And frustration does still exist. Some $300 billion is lost each year in the U.S. from bad search experiences5. Data collected internationally shows that 80% of consumers view a brand differently after experiencing search difficulties, and 97% favor websites where they can quickly find what they are looking for5.
Lessons to Learn
What are the key takeaways for retailers? In general, consider the sources of customer pain points and find ways to erase friction. Improve search and personalization. And focus on improving the customer experience and building loyalty. Specifically:
80% of shoppers want personalization6. Think about how you can drive personalized promotions or experiences that will drive higher engagement with your brand.
46% of consumers want more time to research1. Drive toward providing more robust research and product information points, like comparison charts, images, and specific product details.
43% of consumers want a discount1, but given current economic trends, retailers may not be offering discounts. In order to appease budget-conscious shoppers, retailers can consider other retention strategies such as driving loyalty using points, rewards, or faster-shipping perks.
Be sure to keep returns as simple as possible so consumers feel confident when making a purchase, and reduce possible friction points if a consumer decides to make a return. 43% of shoppers return at least a quarter of the products they buy and do not want to pay for shipping or jump through hoops1.
How We Can Help
Google-sponsored research shows that price, deals, and promotions are important to 68% of back-to-school shoppers.7 In addition, shoppers want certainty that they will get what they want. Google Cloud can make it easier for retailers to enable customers to find the right products with discovery solutions. These solutions provide Google-quality search and recommendations on a retailer’s own digital properties, helping to increase conversions and reduce search abandonment. In addition, Quantum Metric solutions, available on the Google Cloud Marketplace, are built with BigQuery, which helps retailers consolidate and unlock the power of their raw data to identify areas of friction and deliver improved digital shopping experiences.
We invite you to watch the Total Retail webinar “4 ways retailers can get ready for back-to-school, off-to college” on demand and to view the full Back-to-School Retail Benchmarks report from Quantum Metric.
Sources:
1. Back-to-School Retail Benchmarks report from Quantum Metric
2. Google/Ipsos,Moments 2021, Jun 2021, Online survey, US, n=335 Back to School shoppers
3. Google/Ipsos, Moments 2021, Jun 2021, Online survey, US, n=2,006 American general population 18+
4. Google/Ipsos, Holiday Shopping Study, Oct 2021 – Jan 2022, Online survey, US, n=7,253, Americans 18+ who conducted holiday shopping activities in past two days
5. Google Cloud Blog, Nov 2021, “Research: Search abandonment has a lasting impact on brand loyalty”
6. McKinsey & Company, “Personalizing the customer experience: Driving differentiation in retail”
7. Think with Google, July 2021, “What to expect from shoppers this back-to-school season”
Unlocking Data Value: Latest Data Platforms and Announcements at the Next 21

6429
Of your peers have already read this article.
3:30 Minutes
The most insightful time you'll spend today!
Today at Google Cloud Next we are announcing innovations that will enable data teams to simplify how they work with data and derive value from it faster. These new solutions will help organizations build modern data architectures with real-time analytics to power innovative, mission-critical, data-driven applications.
Too often, even the best minds in data are constrained by ineffective systems and technologies. A recent study showed that only 32% of companies surveyed gained value from their data investments. Previous approaches have resulted in difficult to access, slow, unreliable, complex, and fragmented systems.
At Google Cloud, we are committed to changing this reality by helping customers simplify their approach to data to build their data clouds. Google Cloud’s data platform is simply unmatched for speed, scale, security, and reliability for any size organization with built-in, industry-leading machine learning (ML) and artificial intelligence (AI), and an open standards-based approach.
Vertex AI and data platform services unlock rapid ML modeling
With the launch of Vertex AI in May 2021, we empowered data scientists and engineers to build reliable, standardized AI pipelines that take advantage of the power of Google Cloud’s data pipelines. Today, we are taking this a step further with the launch of Vertex AI Workbench, a unified user experience to build and deploy ML models faster, accelerating time-to-value for data scientists and their organizations. We’ve integrated data engineering capabilities directly into the data science environment, which lets you ingest and analyze data, and deploy and manage ML models, all from a single interface.
Data scientists can now build and train models 5X faster on Vertex AI than on traditional notebooks. This is primarily enabled by integrations across data services (like Dataproc, BigQuery, Dataplex, and Looker), which significantly reduce context switching. The unified experience of Vertex AI let’s data scientists coordinate, transform, secure and monitor Machine Learning Operations (MLOps) from within a single interface, for their long-running, self-improving, and safely-managed AI services.
“As per IDC’s AI StrategiesView 2021, model development duration, scalable deployment, and model management are three of the top five challenges in scaling AI initiatives,” said Ritu Jyoti, Group Vice President, AI and Automation Research Practice at IDC. “Vertex AI Workbench provides a collaborative development environment for the entire ML workflow – connecting data services such as BigQuery and Spark on Google Cloud, to Vertex AI and MLOps services. As such, data scientists and engineers will be able to deploy and manage more models, more easily and quickly, from within one interface.”
Ecommerce company, Wayfair, has transformed its merchandising capabilities with data and AI services. “At Wayfair, data is at the center of our business. With more than 22 million products from more than 16,000 suppliers, the process of helping customers find the exact right item for their needs across our vast ecosystem presents exciting challenges,” said Matt Ferrari, Head of Ad Tech, Customer Intelligence, and Machine Learning; Engineering and Product at Wayfair. “From managing our online catalog and inventory, to building a strong logistics network, to making it easier to share product data with suppliers, we rely on services including BigQuery to ensure that we are able to access high-performance, low-maintenance data at scale. Vertex AI Workbench and Vertex AI Training accelerate our adoption of highly scalable model development and training capabilities.”
BigQuery Omni: Breaking data silos with cross-cloud analytics and governance
Businesses across a variety of industries are choosing Google Cloud to develop their data cloud strategies and better predict business outcomes — BigQuery is a key part of that solution portfolio. To address complex data management across hybrid and multicloud environments, this month we are announcing the general availability of BigQuery Omni, which allows customers to analyze data across Google Cloud, AWS, and Azure. Healthcare provider, Johnson and Johnson was able to combine data in Google Cloud and AWS S3 with BigQuery Omni without needing data to migrate.
This flexible, fully-managed, cross-cloud analytics solution allows you to cost-effectively and securely answer questions and share results from a single pane of glass across your datasets, wherever you are. In addition to these multicloud capabilities, Dataplex will be generally available this quarter to provide an intelligent data fabric that enables you to keep your data distributed while making it securely accessible to all your analytics tools.
Spark on Google Cloud simplifies data engineering
To help make data engineering even easier, we are announcing the general availability of Spark on Google Cloud, the world’s first autoscaling and serverless Spark service for the Google Cloud data platform. This allows data engineers, data scientists, and data analysts to use Spark from their preferred interfaces without data replication or custom integrations. Using this capability, developers can write applications and pipelines that autoscale without any manual infrastructure provisioning or tuning. This new service makes Spark a first class citizen on Google Cloud, and enables customers to get started in seconds and scale infinitely, regardless if you start in BigQuery, Dataproc, Dataplex, or Vertex AI.
Spanner meets PostgreSQL: global, relational scale with a popular interface
We’re continuing to make Cloud Spanner, our fully managed, globally scalable, relational database, available to more customers now with a PostgreSQL interface, now in preview. With this new PostgreSQL interface, enterprises can take advantage of Spanner’s unmatched global scale, 99.999% availability, and strong consistency using skills and tools from the popular PostgreSQL ecosystem.
This interface supports Spanner’s rich feature set that uses the most popular PostgreSQL data types and SQL features to reduce the barrier to entry for building transformational applications. Using the tools and skills they already have, developer teams gain flexibility and peace of mind because the schemas and queries they build against the PostgreSQL interface can be easily ported to another Postgres environment. Complete this form to request access to the preview.
Our commitment to the PostgreSQL ecosystem has been long standing. Customers choose Cloud SQL for the flexibility to run PostgreSQL, MySQL and SQL Server workloads. Cloud SQL provides a rich extension collection, configuration flags, and open ecosystem, without the hassle of database provisioning, storage capacity management, or other time-consuming tasks.
Auto Trader has migrated approximately 65% of their Oracle footprint to Cloud SQL, which remains a strategic priority for the company. Using Cloud SQL, BigQuery, and Looker to facilitate access to data for their users, and with Cloud SQL’s fully managed services, Auto Trader’s release cadence has improved by over 140% (year-over-year), enabling an impressive peak of 458 releases to production in a single day.
Looker integrations make augmented analytics a reality
We are announcing a new integration between Tableau and Looker that will allow customers to operationalize analytics and more effectively scale their deployments with trusted, real-time data, and less maintenance for developers and administrators. Tableau customers will soon be able to leverage Looker’s semantic model, enabling new levels of data governance while democratizing access to data. They will also be able to pair their enterprise semantic layer with Tableau’s leading analytics platform. The future might be uncertain, but together with our partners we can help you plan for it.
We remain committed to developing new ways to help organizations go beyond traditional business intelligence with Looker. In addition to innovating within Looker, we’re continuing to integrate within other parts of Google Cloud. Today, we are sharing new ways to help customers deliver trusted data experiences and leverage augmented analytics to take intelligent action.
First, we’re enabling you to democratize access to trusted data in tools where you are already familiar. Connected Sheets already allows you to interactively explore BigQuery data in a familiar spreadsheet interface and will soon be able to leverage the governed data and business metrics in Looker’s semantic model. It will be available in preview by the end of this year.
Another integration we’re announcing is Looker’s Solution for Contact Center AI, which helps you gain a deeper understanding and appreciation of your customers’ full journey by unlocking insights from all of your company’s first-party data, such as contextualizing support calls to make sure your most valuable customers receive the best service.
We’re also sharing the new Looker Block for Healthcare NLP API, which provides simplified access to intelligent insights from unstructured medical text. Compatible with Fast Healthcare Interoperability Resources (FHIR), healthcare providers, payers, and pharma companies can quickly understand the context and relationships of medical concepts within the text, and in turn, can begin to link this to other clinical data sources for additional AI and ML actions.
Bringing the best of Google together with Google Earth Engine and Google Cloud
We are thrilled to announce the preview of Google Earth Engine on Google Cloud. This launch makes Google Earth Engine’s 50+ petabyte catalog of satellite imagery and geospatial data sets available for planetary-scale analysis. Google Cloud customers will be able to integrate Earth Engine with BigQuery, Google Cloud’s ML technologies, and Google Maps Platform. This gives data teams a way to better understand how the world is changing and what actions they can take — from sustainable sourcing, to saving energy and materials costs, to understanding business risks, to serving new customer needs.
For over a decade, Earth Engine has supported the work of researchers and NGOs from around the world, and this new integration brings the best of Google and Google Cloud together to empower enterprises to create a sustainable future for our planet and for your business.
At Google Cloud, we are deeply grateful to work with companies of all sizes, and across industries, to build their data clouds. Join my keynote session to hear how organizations are leveraging the full power of data, from databases to analytics that support decision making to AI and ML that predict and automate the future. We’ll also highlight our latest product innovations for BigQuery, Spanner, Looker, and Vertex AI.
I can’t wait to hear how you will turn data into intelligence and look forward to connecting with you.
Leverage the Power of Looker to Extract Data Value at Web Scale

4456
Of your peers have already read this article.
3:00 Minutes
The most insightful time you'll spend today!
Data science can be applied to business problems to improve practices and help to strengthen customer satisfaction. In this blog, we address how the addition of Looker extends the value of your Google Cloud investments to help you understand your customer journey, unlock value from first-party data, and optimize existing cloud infrastructure.
Data is a powerful tool
While everyone doesn’t need to understand the nuts and bolts of data technologies, most people do care about the value data can create for them — how it can help them do their jobs better. Within the data space, we are seeing a trend of ongoing failure to make data accessible to “humans” – the industry still hasn’t figured out how to put data into the hands of people when and where they need it, how they need it.
What if everyone in your organization could analyze data at scale, and make more-informed, fact-based decisions? Data and insights derived from data are valuable but only if your users see it. We think Looker helps solve that.
Solutions tell a larger story of how it all fits together
Across all verticals and industries, businesses benefit from knowing and understanding their customers better. Many business goals are to increase revenue by improving product recommendations and pricing optimization, improving the user experience through targeted marketing and personalization, and reducing churn while improving retention rates. To help reach these goals, key strategies should focus on understanding customer needs, their motivations, likes and dislikes, and using all available data – in other words, put yourself in the shoes of your customer.
Our goal with Looker solutions is to offer the right level of out-of-box support that allows customers to get to value quickly, while maintaining the necessary flexibility. We aim to offer a library of data-driven solutions that accelerate data projects. Many solutions include Looker Blocks (pre-built pieces of code that accelerate data exploration environments) and Actions (custom integrations) that get customers up and running quickly and lets you build business-friendly access points for Google Cloud functionality like BQML, App Engine and Cloud Functions.
Below, you’ll find a sampling of the newest Looker solutions.
Listening to customers by looking at the data
Looker’s solution for Contact Center AI (CCAI), helps businesses gain a deeper understanding and appreciation of their customers’ full journey by unlocking insights from all their company’s first-party data. Call centers can converse naturally with customers and deliver outstanding experiences by leveraging artificial intelligence. CCAI‘s newest product —CCAI Insights — reviews conversations support agents are having, finding and annotating the data with the important information, and identifying the calls that need review. We’ve partnered with the product teams at CCAI to build Looker’s Block for CCAI Insights, which sets you on the path to integrating the advanced insights into your first-party data in Looker, overlaying business data with the customer experience.

Businesses can better understand contact center experiences and take immediate action when necessary to make sure the most valuable customers receive the best service.
Realizing full business value of First-Party data
Looker for Google Marketing Platform (GMP) provides marketers the power to unlock the value of their company’s first-party data to more effectively target audiences. The Looker Blocks and Actions for GMP offer interactive data exploration, slices of data with built-in ML predictions and activation paths back to the GMP. This strategic solution continues to evolve with the Looker Action for Google Ads (Customer Match), the Looker Action for Google Analytics (Data Import) and the Looker Block for Google Analytics 4 (GA4).
- The Looker Action for Customer Match allows marketers to send segments and audiences based on first-party data directly into Google Ads. Reach users cross-device and across the web’s most powerful channels such as Display, Video, YouTube, and Gmail. The entire process is performed within a single screen in Looker, and is able to be completed in a few minutes by a non-technical user.
- The Looker Action for Data Import can be used to enhance user segmentation and remarketing audiences in Google Analytics by taking advantage of user information accessible in Looker, such as in CRM systems or transactional data warehouses.
- The Looker Block for Google Analytics 4 (GA4) expands the solution’s support with out-of-the-box dashboards and pre-baked BigQuery ML models for the newest version of Google Analytics.The Looker Block offers up reports with flexible configuration capabilities to unlock custom insights beyond the standard GA reporting. Customize audience segments, define custom goals to track and share these reports with teams who do not have access to the GA console.
From clinical notes to patient insights at scale
Taking a look at the Healthcare vertical, the Looker Healthcare NLP API Block serves as a critical bridge between existing care systems and applications hosted on Google Cloud providing a managed solution for storing and accessing healthcare data in Google Cloud. The Healthcare NLP API uses natural language models to extract healthcare information from medical text, rapidly unlocking insights from unstructured medical text and providing medical providers with simplified access to intelligent insights. Healthcare providers, payers, and pharma companies can quickly understand the context and relationships of medical concepts within the text, such as medications, procedures, conditions, clinical history, and begin to link this to other clinical data sources for downstream AI/ML.
Specifically, the natural language processing (NLP) Patient View (pictured below) allows you to review a single selected patient of interest, surfacing their clinical notes history over time. It informs clinical diagnosis with family history insights, which is not currently captured in claims, and captures additional procedure coding for revenue cycle purposes.

The dashboard below shows the NLP Term View which allows users to focus on chosen medical terms across the entire patient population in the dataset so they can start to view trends and patterns across groups of patients.

This data can be used to:
- Enhance patient matching for clinical trials
- Identify re-purposed medications
- Drive advancements for research in cancer and rare diseases
- Identify how social determinants of health impact access to care
Managing Costs Across Clouds
Effective cloud cost management is important for reasons beyond cost control — it provides you the ability to reduce waste and predictably forecast both costs and resource needs. Looker’s solution for Cloud Cost Management offers quick access to necessary reporting and clear insights into cloud expenditures and utilization.
This solution brings together billing data from different cloud providers in a phased approach: get up and running quickly with Blocks optimized for where the data is today (Google Cloud, AWS or Azure) as you work towards more sophisticated analysis for cross-platform planning and even cloud spend optimization with the mapping of tags, labels and cost centers across clouds.
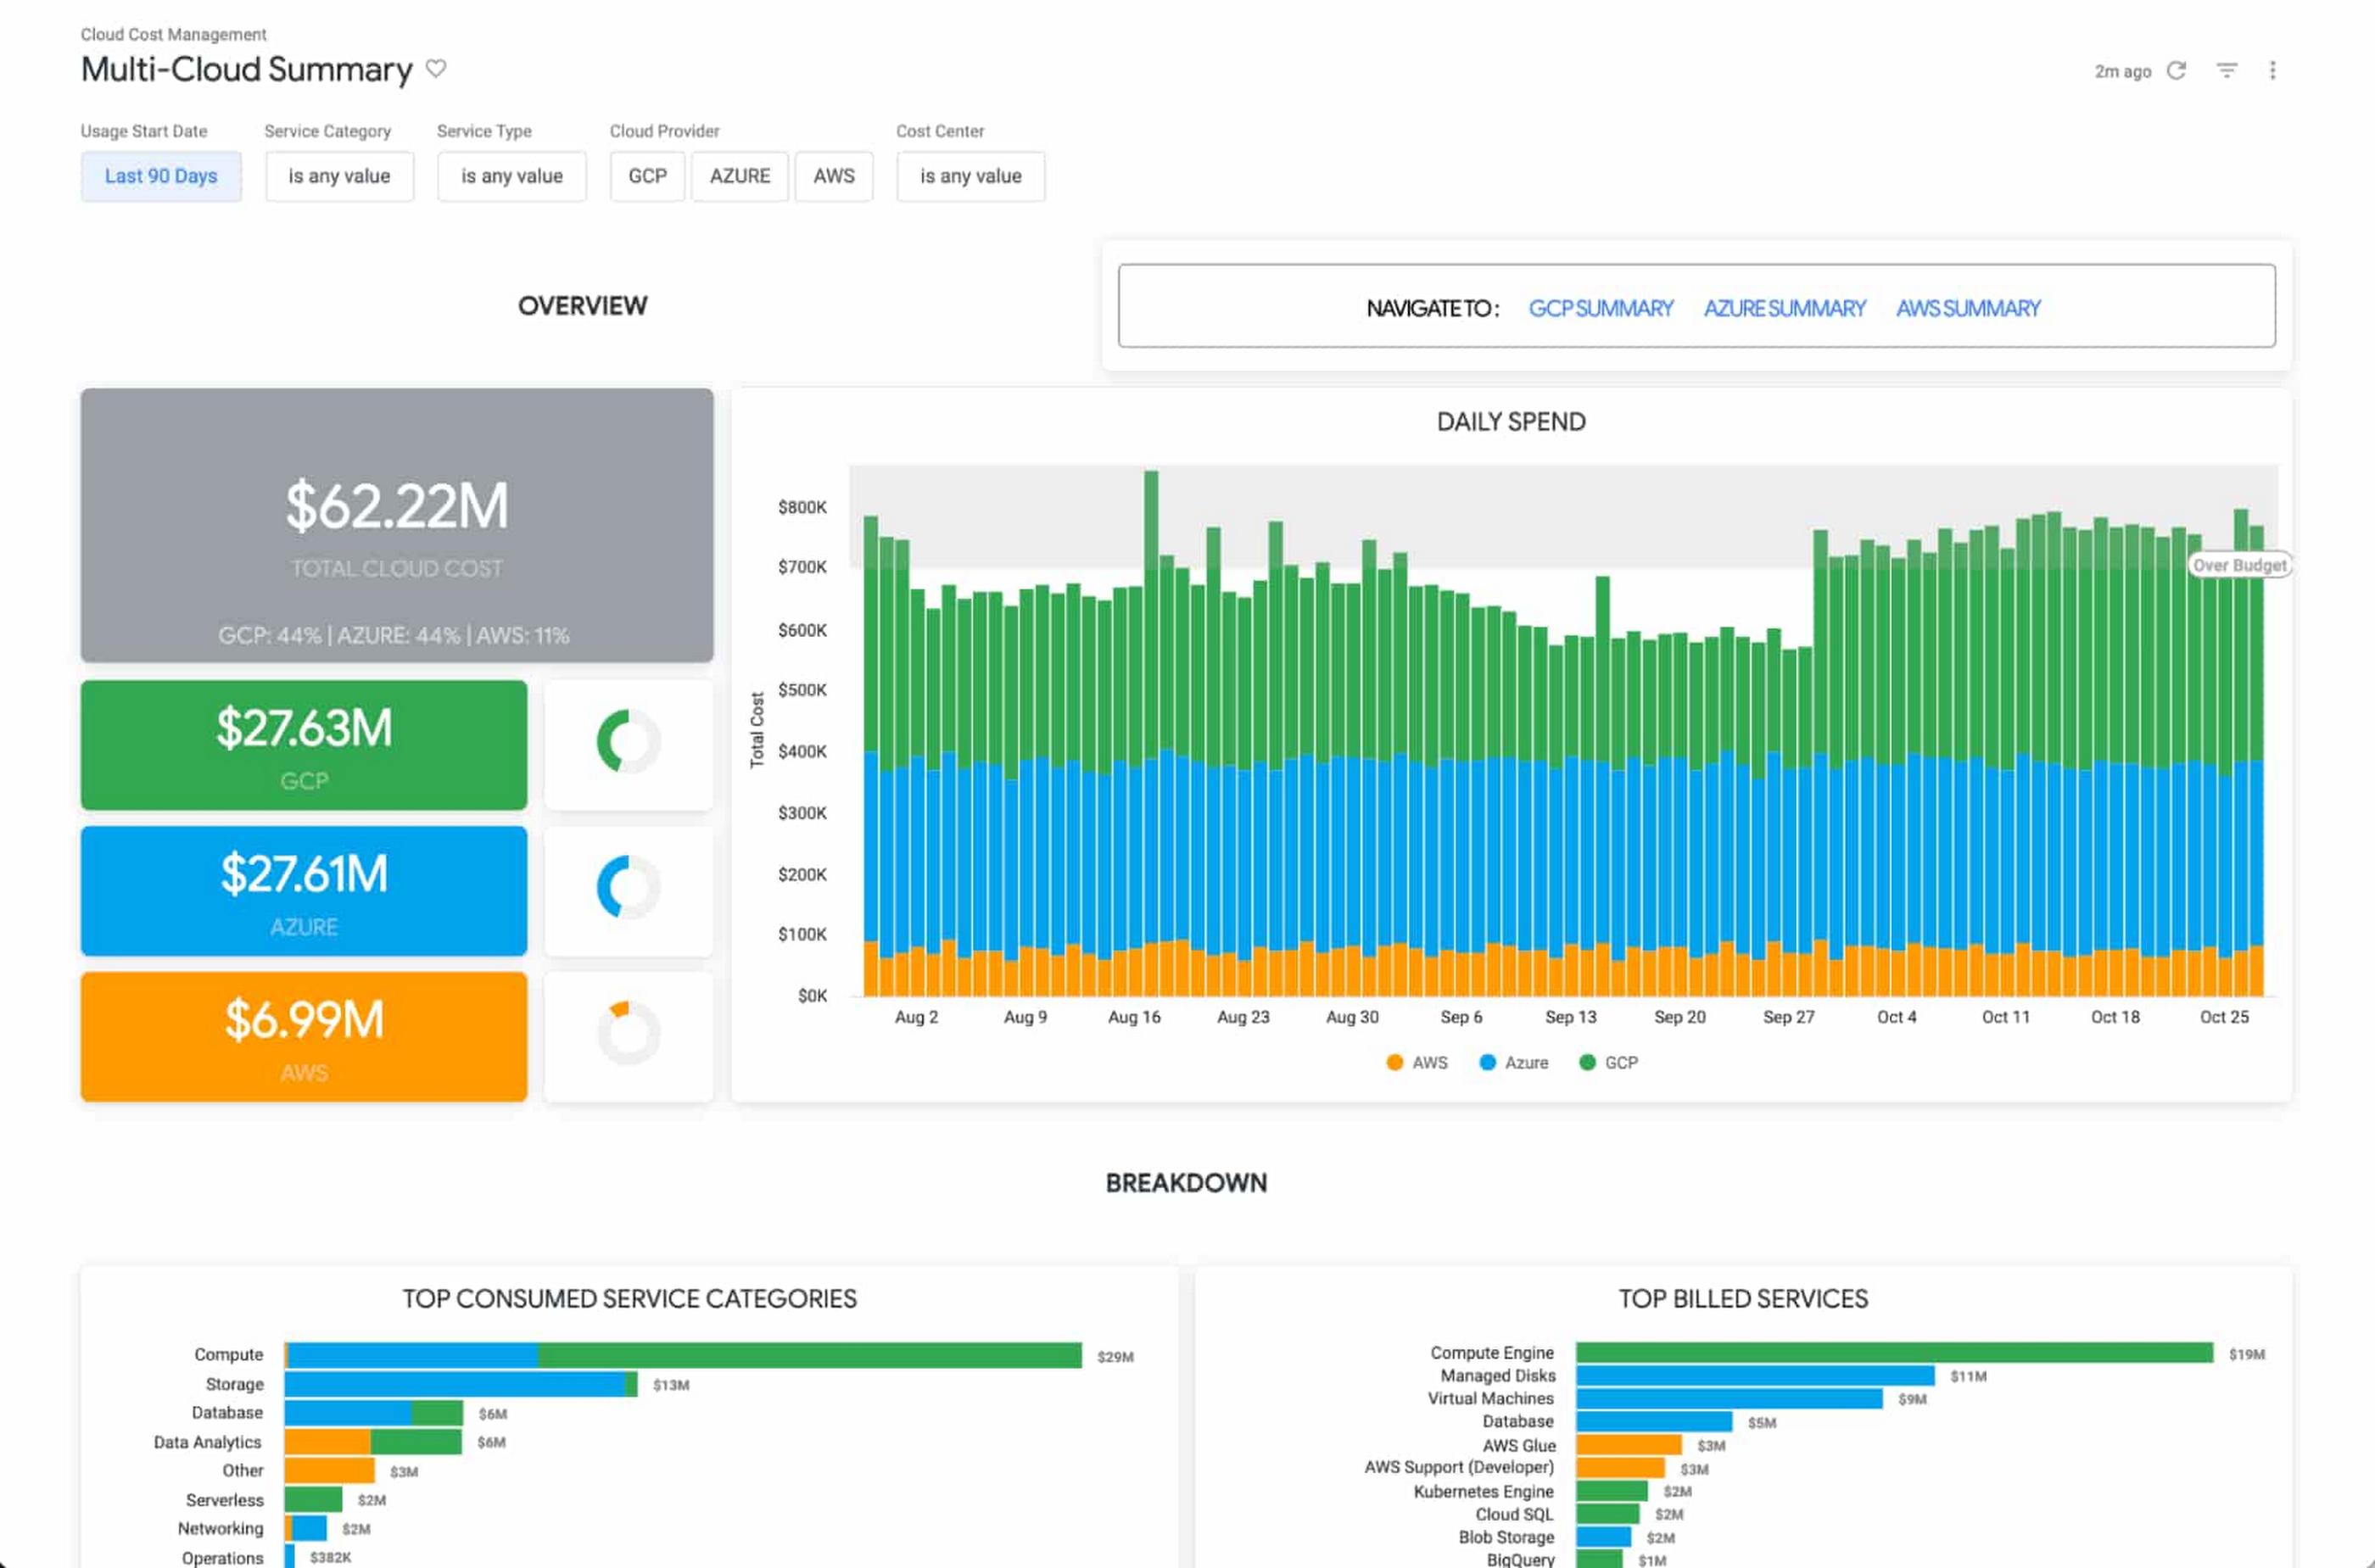
The Looker Cloud Cost Management solution provides operational teams struggling to monitor, understand, and manage the costs and needs associated with their cloud technology with a comprehensive view into what, where and why they are spending money.
Making better decisions with Looker-powered data
Leading companies are discovering ways to get value from all of that data beyond displaying it in a report or a dashboard. They want to enable everyone to make better decisions but that’s only going to happen if everyone can ask questions of the data, and get reliable, correct answers without using outdated or incomplete data and without waiting for it. People and systems need to have data available to them in the way that makes the most sense for them at that moment.
It’s clear that successful data-driven organizations will lead their respective segments not because they use data to create reports, but because they use it to power data experiences tailored to every part of the business, including employees, customers, operational workflows, products and services.
As people’s way of experiencing data has evolved, more than ever before, dashboards alone are not enough. You can use data as fuel for data-driven business workflows, and to power digital experiences that improve customer engagement, conversions, and advocacy.
From Nov. 9 – 11th, Looker is hosting its annual conference JOIN, where we’ll be showing new features, including how we help to:
- Build data experiences at the speed of business
- Accelerate the business value with packaged experiences
- Unleash more insights for more people in the right way – Deliver data experiences at scale
There is no cost to attend JOIN. Register here and learn how Looker helps organizations build and deliver custom data-driven experiences that goes beyond just reports and dashboards, scales and grows with your business, allows developers to build innovative data products faster, and ensures data reaches everyone.
Data Cloud Skills to Pick Up in 2022: Google Experts Recommended

4967
Of your peers have already read this article.
3:00 Minutes
The most insightful time you'll spend today!
It’s 2022 and nanosatellites, NFTs, and autonomous cars that deliver your pizza are in full force. In a world where people rely on simple technology to untangle complex problems, companies must deliver simple experiences to be successful in today’s landscape. For many cloud providers this means enabling tightly integrated data offerings that simplify the data delivery process without losing sight of the sophisticated needs of the modern data consumer.
But while the name of the game is helping companies reach informed decisions from their data simpler and faster, what about the data practitioners – data analysts, data engineers, database administrators, developers, etc – who use these cloud data tools and technologies everyday? To proactively stay ahead of data cloud market trends in 2022 should data practitioners invest their time in specializing their data cloud skill sets (e.g. go deep in, say, data pipelining skills) or instead invest their time generalizing their data cloud skill sets (e.g. growing proficiencies in a mix of data analytics, databases, AI/ML, and more domains)?
Skill deep or wide with data – that is the question
For Abdul Razack, VP, Solutions Engineering, Technology Solutions and Strategy at Google Cloud, the answer is a bit of both.
“Data practitioners need to be broad in terms of their technology skills, but specialized with respect to the domain or domains in which they apply them. The reason why is because many things that used to be separate skill sets are now converging – like business analytics, streaming, machine learning, data pipelines, and data warehousing. Data practitioners need to be able to implement end-to-end workflows that solve specific business problems using skills from each category.”
It’s true, thousands of customers are choosing Google’s data cloud because it offers a unified and open approach to cloud that enables their practitioners to break down silos, begin and end projects without leaving the data platform, and innovate faster across their organization.
The data practitioners who mirror Google data cloud’s frame of mind of being smart and agile across data domains in their skilling and learning will reap the benefits of solving more nuanced problems – building out internet-scale applications, fine tuning smart processes with analytics and AI, constructing data meshes that make product building simple, etc – at a larger scale than they would if they specialized in just one or two areas alone.
“Of course at the end of the day it depends on what tools a data practitioner is using to complete their workflows. There’s only so much you can learn and skills you can develop when you’re using limited tools. Growing data proficiencies across the board is made a lot easier when you’re using a data platform like BigQuery to address all these needs. BigQuery eliminates the choices you have to make – for instance you don’t have to choose between streaming data and data at rest, batch and realtime, or business intelligence and data science. This freedom gives data professionals a huge advantage when they’re building their skill sets and taking on more complex projects.” -Abdul Razack – VP, Solutions Engineering, Technology Solutions and Strategy, Google Cloud
Knowing your value is half the battle when upskilling
While some experts think technology is the limiting factor of whether or not you can even go wide or go deep in the first place, others like Google Cloud’s Head of Data and Analytics Bruno Aziza purport that it also depends on who you are, who you wish to be, and what investments your company is making to ensure you can become that person.
“If you wish to set yourself up to be a Chief Data Officer, then you’ll want to understand how technologies fit together across your data estate first” said Aziza. “Only after you feel like you’re the go-to ‘data person’ can you then decide which part of the technology stack you want to double-down on.”
But technology isn’t everything. Aziza notes, “Make sure you focus on the business impact that your data work provides. You want to spend as much time as you can with your business counterparts to understand their business goals and challenges. The Harvard Business Review provides great guidance on how to succeed as a Chief Data Officer.”
Even if you don’t have your sights set on a C-suite role, both Aziza and Razack contend that the number one skill data practitioners should tackle in 2022 is actually a broad and perhaps abstract one: develop and exercise the curiosity to solve problems with a data-driven strategy.
That is, today’s data practitioners should always be interested in educating themselves in the industry and continually upskilling in something. And their employers should also be invested in helping practitioners develop those interests, most likely through exposure to learning materials, engaging in career conversations, subsidized courses, or incentives attached to pursuing a new certification or skill.
“Every industry is going through a digital transformation and the ability to identify what data to collect, how to prepare the data, and how to derive insights from it is critical. Therefore, the ability to find business challenges and formulate a data-driven approach to address those problems is the most important skill to have.” Abdul Razack – VP, Solutions Engineering, Technology Solutions and Strategy, Google Cloud.
Take the example of the “Data Mesh” I just wrote about in VentureBeat. You’ll find 3 types of attitudes towards this new concept. There are Disciples who encourage continued learning only from the source – like the author of a new book or the creator of a theory. There are Distractors who tell you that new skills, trends, and technologies are fake news. And there are Distorters like vendors who will sell you one easy fix solution. But it’s the data practitioner who needs to proceed with caution when interacting with all three types and forge their own path to discovering the truth when they’re learning and building skills. And for better or worse, this comes with trial and error, experimentation, and an eagerness to grow relative to where they began.”
Ready to start data upskilling? Start here.
For those interested in keeping up their data curiosities, check out our Data Journeys video series. Each week Bruno Aziza investigates a new authentic customer’s data journey – from migrating to cloud or building a data platform to carrying out new data for good initiatives. Learn how they did it, their data dos and don’ts, and what’s next for them on their journey. These videos include a flavor of both specializing your data competencies and broadening your data competencies.
For those interested in deepskilling, connect with Google’s data community at our upcoming virtual event: Latest Google Cloud data analytics innovations. Register and save your spot now to get your data questions answered live by GCP’s top data leaders and watch demos from our latest products and features including BigQuery, Dataproc, Dataplex, Dataflow, and more.
If you have any questions or need support along your learning journey – we’re here for you! Sign up to be a Google Cloud Innovator, and join the Google Cloud Data Analytics Community.
Google Cloud Tools Help U.S. Forest Department Generate Years of Insights into Earth’s Natural Resources

5021
Of your peers have already read this article.
3:00 Minutes
The most insightful time you'll spend today!
For 117 years, the U.S. Department of Agriculture’s Forest Service has been a steward of America’s forests, grasslands, and waterways. It directly manages 193 million acres and supports sustainable management on a total of 500 million acres of private, state, and tribal lands. Its impact reaches far beyond even that, offering its research and learning freely to the world.
At Google, we’re big admirers of the Forest Service’s mission. So we were thrilled to learn in 2011 that its scientists were using Google Earth Engine, our planetary-scale platform for Earth Science data and analysis, to aid its research, understanding, and effectiveness. In the years since, Google has worked with the Forest Service to meet its unique requirements for visual information about the planet. Using both historical and current data, the Forest Service built new products, workflows, and tools that help more effectively and sustainably manage our natural resources. The Forest Service also uses Earth Engine and Google Cloud to study the effects of climate change, forest fires, insects and disease, helping them create new insights and strategies.

Besides gaining newfound depths of insight, the Forest Service has also sped up its research dramatically, enabling everyone to do more. Using Google Cloud and Earth Engine, the Forest Service reduced the time it took to analyze 10 years worth of land-cover changes from three months to just one hour, using just 100 lines of code. The agency built new models for coping with change, then mapped these changes over time, in its Landscape Change Monitoring System (LCMS) project.
Emergency responders can now work better on new threats that arise after wildfires, hurricanes, and other natural disasters. Forest health specialists can detect and monitor the impacts of invasive insects, diseases, and drought. More Forest Service personnel can use new tools and products within Earth Engine, thanks to numerous training and outreach sessions within the Forest Service.
Researchers elsewhere also benefited when the Forest Service created new toolkits, and posted them to GitHub for public use. For example, there’s geeViz, a repository of Google Earth Engine Python code modules useful for general data processing, analysis, and visualization.
This is only the start. Recently, the Forest Service started using Google Cloud’s processing and analysis tools for projects like California’s Wildfire and Forest Resilience Action Plan. Forest Service researchers also use Google Cloud to better understand ecological conditions across landscapes in projects like Fuelcast, which provides actionable intelligence for rangeland managers, fire specialists, and growers, and the Scenario Investment Planning Platform for modeling local and national land management scenarios.
The Forest Service is a pioneer in building technology to help us better understand and care for our planet. With more frequent imaging, rich satellite data sets, and sophisticated database and computation systems, we can view and model the Earth as a large-scale dynamic system.
We are honored and excited to respond to the unique set of requirements of the scientists, engineers, rangers, and firefighters of the USFS, and look forward to years of learning about — and better caring for — our most precious resources.
*Image 1: The USDA Forest Service (USFS) Geospatial Technology and Applications Center (GTAC) uses science-based remote sensing methods to characterize vegetation and soil condition after wildland fire events. The results are used to facilitate emergency assessments to support hazard mitigation, to inform post-fire restoration planning, and to support the monitoring of national fire policy effectiveness. GTAC currently conducts these mapping efforts using long-established geospatial workflows. However, GTAC has adapted its post-fire mapping and assessment workflows to work within Google Earth Engine (GEE) to accommodate the needs of other users in the USFS. The spatially and temporally comprehensive coverage of moderate resolution multispectral data sources (e.g., Landsat, Sentinel 2) and analytical power provided by GEE allows users to create geospatial burn severity products quickly and easily. Box 1 shows a pre-fire Sentinel-2 false color composite image. Box 2 shows a post-fire Sentinel-2 false color composite image with the fire scar apparent in reddish brown. Box 3 shows a differenced Normalized Burn Ratio (dNBR) image showing the change between the pre- and post-fire images in Boxes 1 and 2. Box 4 shows a thresholded dNBR image of the burned area with four classes of burn severity (unburned to high severity), which is the final output delivered to forest managers.
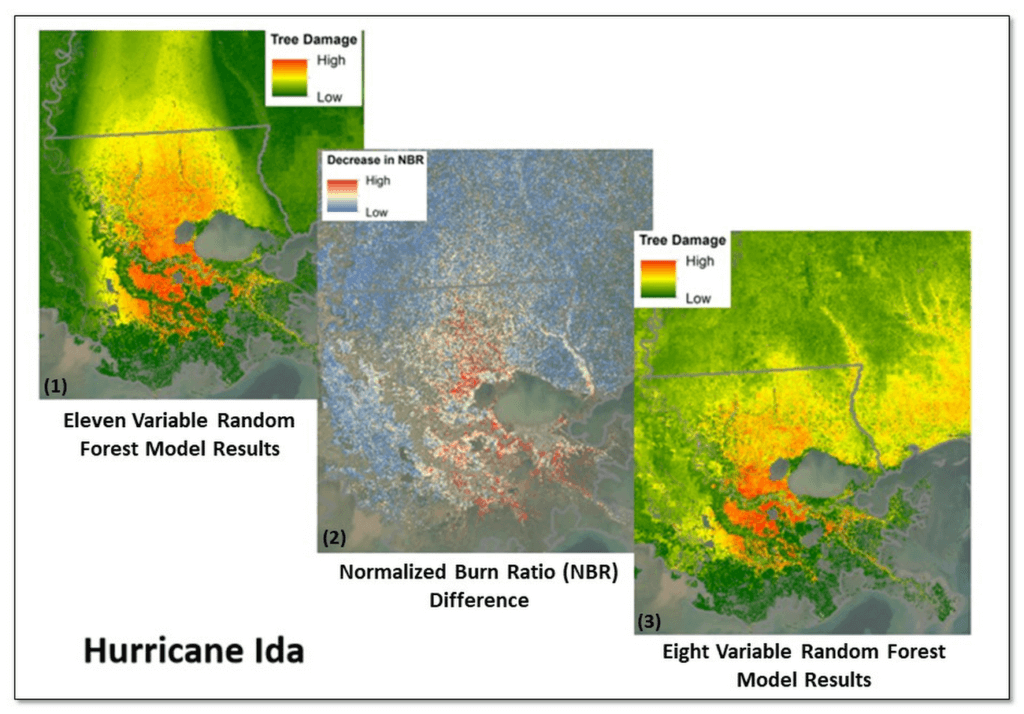
*Image 2: Leveraging Google Earth Engine (GEE), the USDA Forest Service (USFS) Geospatial Technology and Applications Center (GTAC) and USFS Region 8, developed the Tree Structure Damage Impact Predictive (TreeS-DIP) modeling approach to predict wind damage to trees resulting from large hurricane events and produce spatial products across the landscape. TreeS-DIP results become available within 48 hours following landfall of a large storm event to allow allocation of ground resources to the field for strategic planning and management. Boxes 1 and 3 above show TreeS-DIP modeled outputs with varying data inputs and parameters. Box 2 shows changes in greenness (Normalized Burn Ratio; NBR) that was measured with GEE during the recovery from Hurricane Ida and is shown as a visual comparison to the rapidly available products from TreeS-DIP.
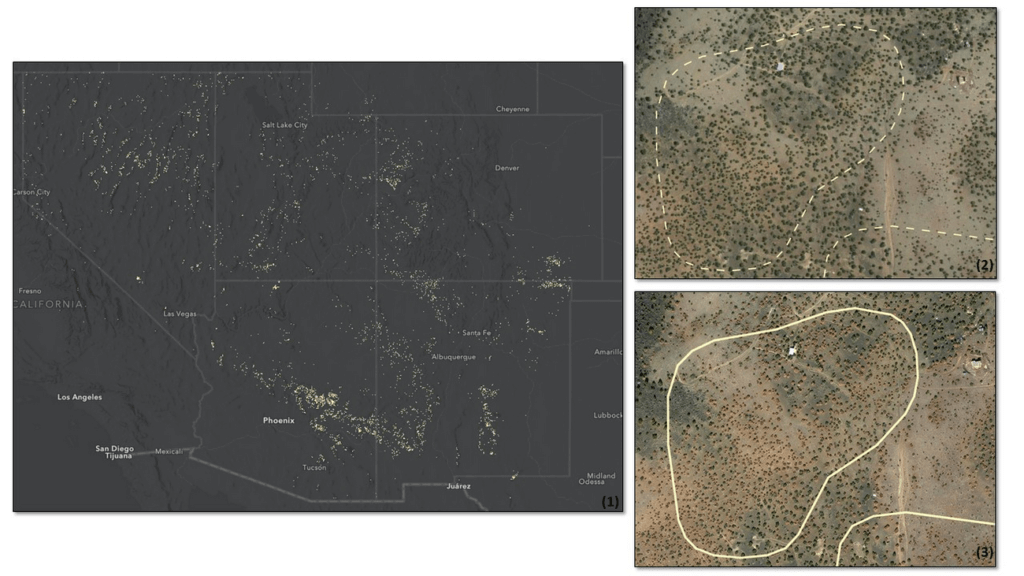
*Image 3: Severe drought conditions across the American West prompted concern about the health and status of pinyon-juniper woodlands, a vast and unique ecosystem. In a cooperative project between the USDA Forest Service (USFS) Geospatial Technology and Applications Center (GTAC) and Forest Health Protection (FHP), Google Earth Engine (GEE) was used to map pinyon pine and juniper mortality across 10 Western US States. The outputs are now being used to plan for future work including on-the-ground efforts, high-resolution imagery acquisitions, aerial surveys, in-depth mortality modeling, and planning for 2022 field season work.
Box 1 contains remote sensing change detection outputs (in white) generated with GEE, showing pinyon-juniper decline across the Southwestern US. Box 2 shows NAIP imagery from 2017 with, with box 3 showing NAIP imagery from 2021. NAIP imagery from these years shows trees changing from healthy and green in 2017 to brown and dying in 2021. In addition, box 2 and box 3 show change detection outputs from Box 1 for a location outside of Flagstaff, AZ converted to polygons (in white). The polygon in box 2 is displayed as a dashed line to serve as a reference, while the solid line in box 3 shows the measured change in 2021. Converting rasters to polygons allows the data to be easily used on tablet computers, as well as the ability to add information and photographs from field visits.
More Relevant Stories for Your Company

A Look Back on Google Cloud’s Data Analytics Development Efforts from June
June is the month that holds the summer solstice, and some of us in the northern hemisphere get to enjoy the longest days of sunshine out of the entire year. We used all the hours we could in June to deliver a flurry of new features across BigQuery, Dataflow, Data

Mrs. T’s Pierogies Moves SAP Systems to Google Cloud for Faster Analytics Capabilities for its SAP Data
Pierogies might just be the ultimate comfort food. But when Mrs. T’s Pierogies — the leading manufacturer of frozen pierogies in the US — learned it needed to transition its existing on-premises SAP ECC to S/4HANA, the company sought a little comfort for itself. Founded in 1952, Mrs. T’s Pierogies

AirAsia Leverages Google Cloud to Enhance Pricing, Revenue, and Customer Experience
With Google Cloud, AirAsia is now a “data first” business that can capture, analyze, and report on rising volumes of data to address complex problems and increase revenue streams. The airline is also using AI-powered chatbots to streamline internal operations and provide a faster, more efficient service. Become a digital

How Real IT Leaders Create a Machine Learning Strategy
Sure, machine learning is becoming a business imperative, but how does it work in practice? That’s the subject of a new step-by-step guide to solving business problems with artificial intelligence and ML, based on insights gathered by IDG Research Services. Its publication comes at a time when technology leaders face
