





Manhattan Associates’ Seamless Migration to Google Cloud SQL

3388
Of your peers have already read this article.
3:30 Minutes
The most insightful time you'll spend today!
Editor’s note: Manhattan Associates provides transformative, modern supply chain and omnichannel commerce solutions. It enhanced the scalability, availability, and reliability of its software-as-a-service through a seamless migration to Google Cloud SQL for MySQL.
Geopolitical shifts and global pandemics have made the global supply chain increasingly unpredictable and complex.
At Manhattan Associates, we help many of the world’s leading organizations navigate that complexity through industry-leading supply chain commerce solutions like warehouse management, transportation management, order management, point of sale and much more, to continuously exceed increasing expectations.
The foundation for those solutions is Manhattan Active® Platform, a cloud-native, API-first microservices technology platform that’s been engineered to handle the most complex supply chain networks in the world and designed to never feel like it.
Manhattan Active solutions enable our clients to deliver exceptional shopping experiences in the store, online, and everywhere in between. They unify warehouse, automation, labor and transportation activities, bolster resilience, and seamlessly support growing sustainability requirements.
More Resiliency and Less Downtime
Manhattan Active solutions run 24×7 and need a database solution that can support this. Cloud SQL for MySQL helps us meet our availability goals with automatic failovers, automatic backups, point-in-time recovery, binary log management, and more. Cloud SQL also allows us to create in-region and cross-region replicas efficiently with near zero replication lags. We can create a new replica for a TB size DB in under 30 minutes, a process which used to take several days.
We provide a 99.9% overall up-time service level agreement (SLA) for Manhattan Active Platform, and Cloud SQL helps us keep that promise. Unplanned downtime is 83% less than it would have been with our previous database solutions.
Flexibility and Total Cost of Ownership
One of the fundamental requirements in a cloud-native platform like Manhattan Active is a robust, efficient, and cost-effective database. Our original database solutions struggled across different cloud platforms and created challenges in total cost of ownership and licensing.
We needed a more cost-efficient approach to managing a highly reliable and available database engine that could operate as a managed service, and Cloud SQL delivered.
We were able to move every Manhattan Active solution from our previous cloud vendor to Google Cloud, including the shift to Cloud SQL, with less than four hours of downtime.
Today, we run hundreds of Cloud SQL instances and operate most of them with just a few database administrators (DBA). By offloading the majority of our database management tasks to Cloud SQL, we significantly reduced the cost to maintain Manhattan Active Platform databases.
We also need a solution where we resize our database within minutes. This requirement is needed to manage database performance and infrastructure costs. The ease of resizing our database within minutes allows us to keep the optimal performance levels and saves significantly on overall infrastructure costs.
A Winning Innovation Combination
Cloud SQL provides highly scalable, available, and reliable database capabilities within Manhattan Active Platform, which helps us provide significantly better outcomes for our clients and better experiences for their customers.
Learn more about how you can use Cloud SQL at your organization. Get started today.
Incorporating Custom Holidays into Your Time-Series Models with BigQuery ML

1112
Of your peers have already read this article.
4:30 Minutes
The most insightful time you'll spend today!
About three years ago, JCB, one of the biggest Japanese payment companies, launched a project to develop new high-value services with agility. We set up a policy of starting small from scratch without using the existing system, which we call the concept of “Dejima”, where we focused on improving various aspects such as team structure, risk management, and application and platform development process.
Until now, large Japanese enterprises have built decision-making systems focused on eliminating unnecessary business processes and efficiently increasing quarterly profits. As a result, we are seeing more organizational structures that make it difficult to take on new challenges or experiments with trial and error. We wanted to breathe a new life into this situation, and that is how the concept of Dejima came up. In the Edo period, Japan closed its national border to other countries under its national isolation policy. At the time, Dejima was the only area where special rules were applied and allowed people from different cultures to come and go, and trade. This special rule generated the culture of inclusion and led to Dejima’s prosperity. Like Dejima, we believe that creating an organization that is independent from other business practices can be effective in enabling digital transformation for the organization.
We have been able to make this transformation with the direct help of the Google Cloud and its products such as Google Kubernetes Engine (GKE), Cloud Spanner and Anthos Service Mesh, applying domain-driven design and microservice architecture. We named this the “JCB Digital Enablement Platform (JDEP),” which now hosts multiple business critical production services.
A key benefit of GKE is that the team can easily add resources and release them when they are finished, allowing them to be flexible to accommodate busy periods and off-seasons. Meanwhile, Anthos Service Mesh helps us manage complex environments easily. With containerization and managed services, we are prepared for the future for when more services go into production, as it would be easy to maintain and provide version upgrade support. At the same time, Cloud Spanner ensures that we maintain a 99.99% availability at all times.
Our initial motivation for introducing SRE practices was to break proverbial walls between business, development and operations, which was a success. Now we are focused on ensuring its reliability and maintaining customer satisfaction with our SRE practices.
To ensure the success of SRE practices that we implemented, there were a few categories we needed to address, from defining the organizational culture and practices to ensuring the policies attached to the new models created were practical enough to be implemented on the ground level. This is so that the Dejima concept remains sustainable for the long run.
Instilling a culture of measurement
Here, “appropriate” reliability is the key. According to the conventional way of thinking at JCB, “service failure must not occur” and “SLA should be maintained as high as possible.” We started by discussing what was the “appropriate reliability” that our customers really needed, but it was not as easy as we thought because the level of reliability for user satisfaction differed from application to application.
Eventually, the business, development and operations teams formulated specific SLIs and SLOs together, something we would never have been able to do if we discussed separately. This is because the business is required to compromise on lower service levels, since our reliability standard used to be too high. The collaboration of development and operations teams is necessary to understand how our system works upon our users’ interactions.
After Google Cloud helped us run a series of workshops where all teams participated, we saw change within the organization. The business team started evangelizing SRE to other members in the business department, and the development and operations teams started collaborating autonomously. We felt like we were working at Google speed, accomplishing so much in a short amount of time.
Understanding SRE as an entire company is necessary to progress. We are now working on creating internal training materials to spread the SRE concept throughout the company.
Eliminating ambiguity
With the cooperation of Google Cloud, we have created a Team Charter that defines the team’s mission, values and engagement models. We also created policy documents that include Incident Response Policy, Postmortem Policy, On-call Policy, Toil Policy and Error Budget Policy, to eliminate ambiguity in day-to-day operations.
For example, when an incident occurs, we can identify exactly the level of importance, the roles that are assigned to each person, and in what order they need to follow. When to do a postmortem, who owns it? What to do if the error budget is exhausted? How do other teams reach out to SRE when they have problems? The written policy documents will dramatically improve efficiency and motivate teams to adopt a culture of learning from failures.
The format for such policies are written in Google’s SRE book, but when we adopt it, it needs to take into account the circumstances specific to our company. Simply copying an existing policy won’t work, which is why it’s important to formulate a policy that fits the situation each team is in.
Reformalizing teams
Based on these policies, JCB’s SRE team has two sub-teams. One is called Sheriff which works as the platform SRE, and provides infrastructure services for the application team. The other is called the Diplomat which works as the embedded SRE, and participates in the application team to lead productionisation. There is also a team called Architecture that is separate from the SRE teams whose role is to consult SRE on system design and review architecture.
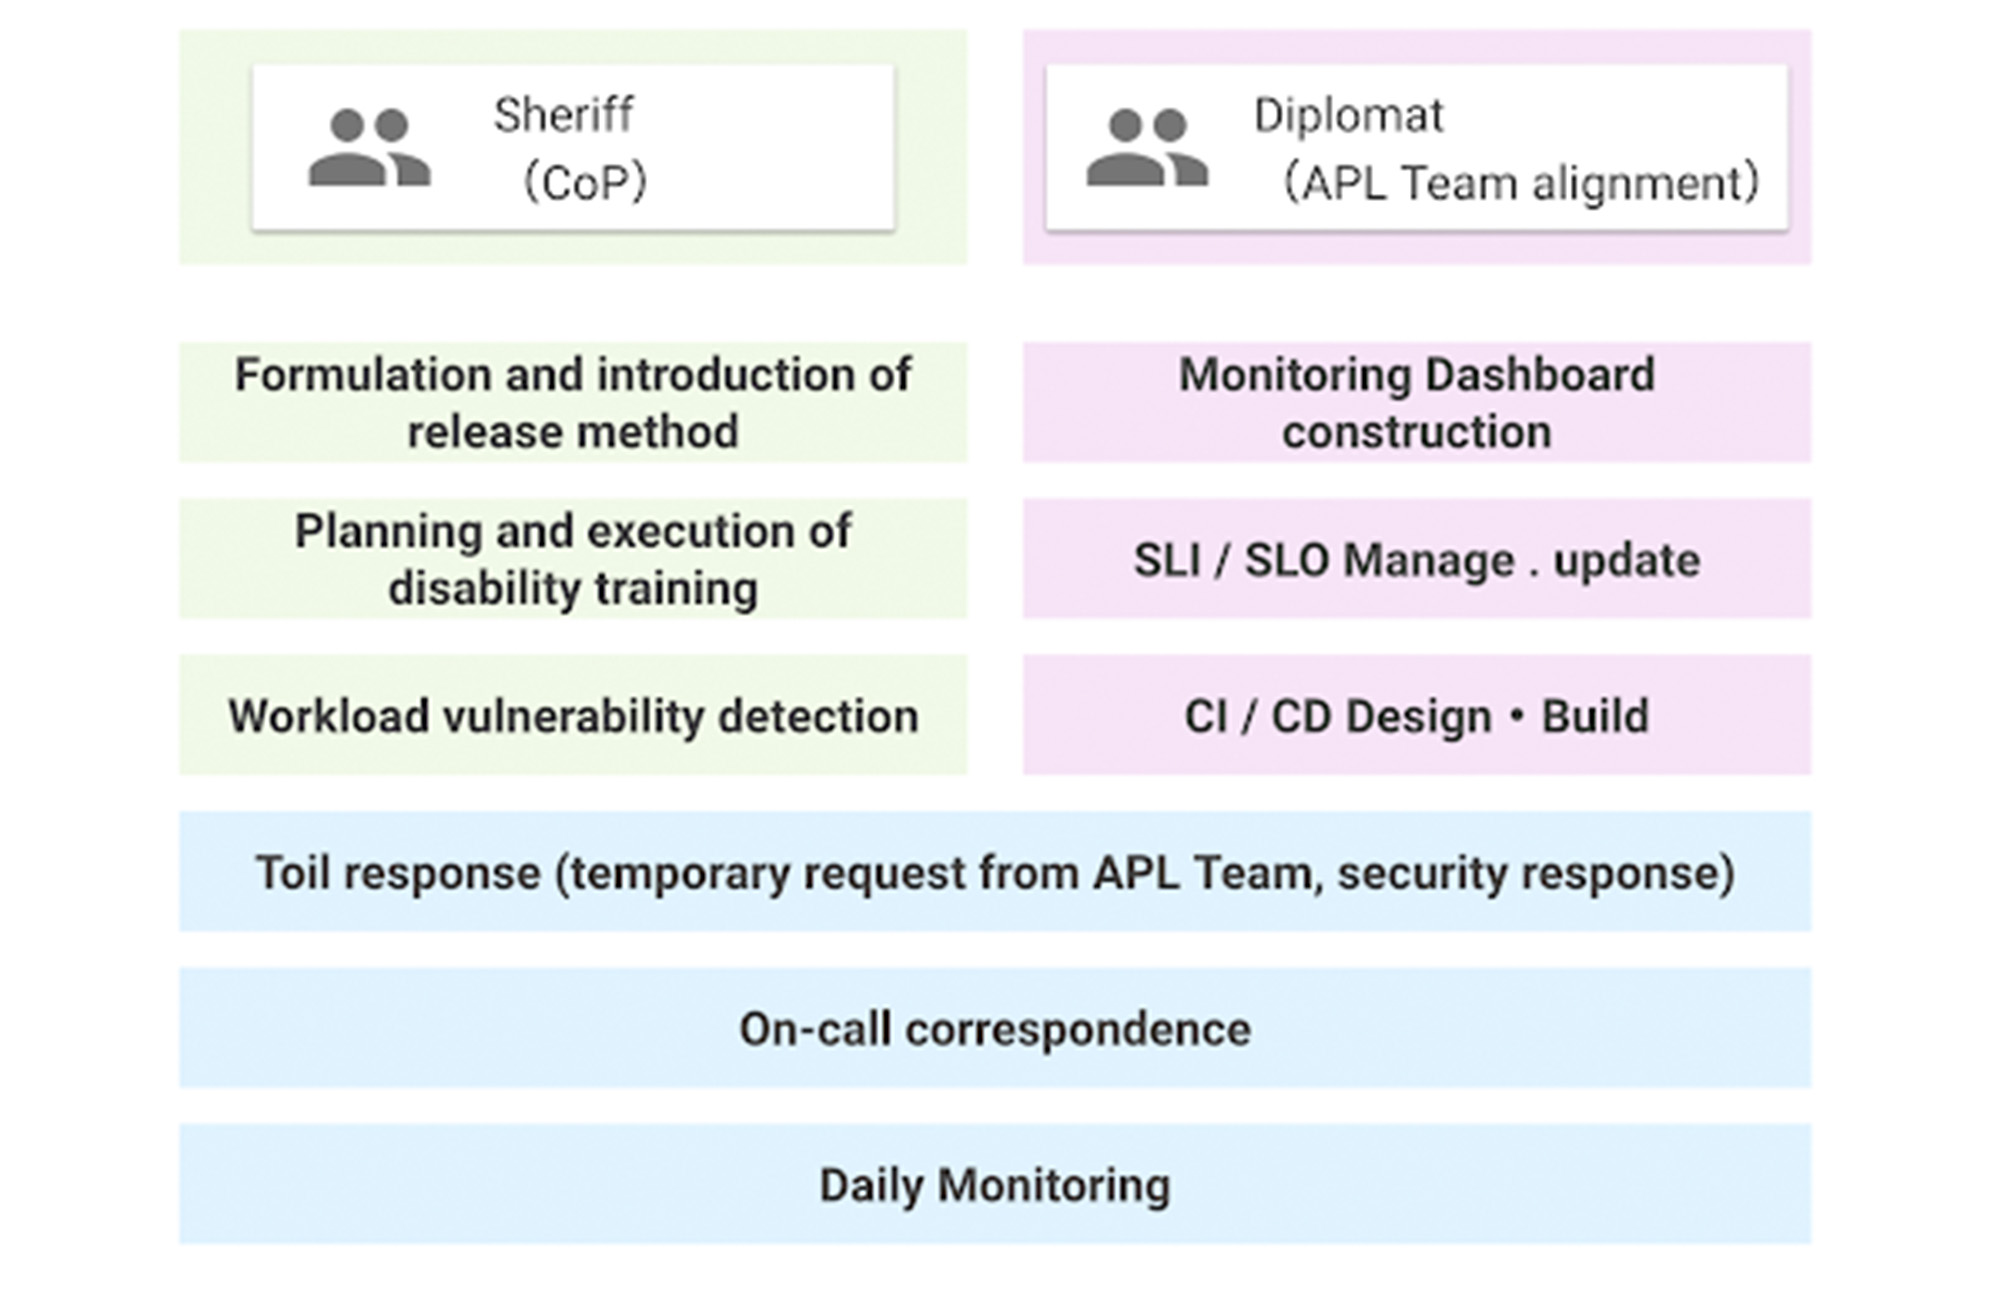
The SRE team was a single role when it was first launched, but now has two sub-teams. This is because as the number of application teams increases, the number of support tasks for the teams also increases, which can result in a shortage of resources to work on overall improvement. Securing people who are not interrupted from day-to-day support tasks and focusing on the main task improves efficiency.
Whereas both sub-teams share the on-call duty, some engineers are not allowed to do it by contract as they are not allowed to get paged. For those who cannot participate in on-call duties, we created what’s called a Toil Shift, which allows them to focus on resolving tickets in our backlogs instead.
This works well so far, but we will keep evolving as our business grows.
Datashare for Financial Services: Securing the Publishers and Consumers’ Access to Market Data

8554
Of your peers have already read this article.
4:30 Minutes
The most insightful time you'll spend today!
Access to the cloud has advanced the distribution and consumption of financial information on a global scale. In parallel, the global financial data landscape has been transformed by an influx of alternative data sources, including social media, meteorological data, satellite imagery, and other data. Exchanges and market data providers now find they need to include these new datasets to enrich their products and compete, which has meant they now must consider cloud-based models to keep up with the demands of their customers who expect easy, quick, flexible and cost-efficient ways to consume market data.
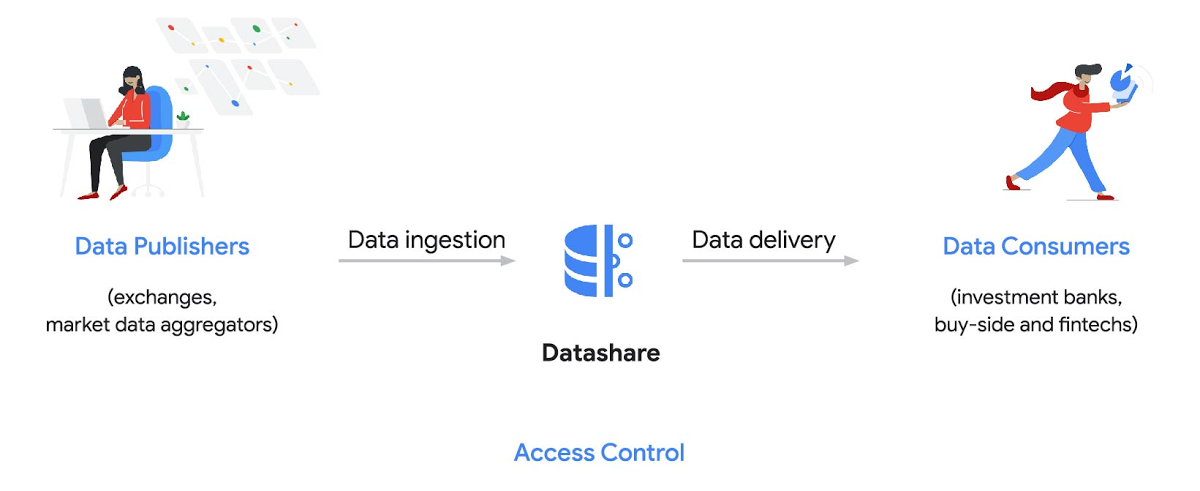
To address these needs, today we’re announcing the general availability of Datashare for financial services, a new Google Cloud solution that brings together the entire capital markets ecosystem—data publishers, and data consumers—to exchange market data securely and easily.
Datashare helps organize third-party financial information, making it accessible and useful to market data publishers and data consumers. We open-sourced the entire Datashare solution so market data publishers can now onboard their licensed datasets to Google Cloud securely, quickly and easily, while data consumers can consume that data as a service in tools of their preference, such as BigQuery.
Three ways to distribute and consume your data
Batch data delivery
Datashare provides a batch data delivery mechanism for data publishers to deliver their reference data, historical tick data, alternative market data sources and more via BigQuery, reducing the administrative burden on data consumers to extract insights from data.
Real-time data streaming delivery
By using this event-based data delivery channel for rapidly changing instrument prices, tick data, orders, news and others via Pub/Sub, data consumers can reliably process individual messages or rewind to a point in time to replay a prior market scenario and test model changes.
Monetizing licensed datasets
Market data publishers can onboard their licensed datasets to Google Cloud and make them available via a one-stop-shop on Google Cloud Marketplace, enabling a new sales channel to expand market reach.
Reference architecture
Check out the diagram below to see how you can share your batch and real-time data directly to your Google Cloud customers with BigQuery and Pub/Sub.

As you can see in the above reference architecture, both publishers and consumers can derive several benefits from the solution:
Benefits for data publishers
- You no longer have to maintain your own delivery and licensing infrastructure.
- You can easily package and deliver granular data products and experiments with SQL.
- You can have a solution that scales with your business as data volumes and number of customers grow.
Benefits for data consumers
- Your data is ready for analysis and machine learning (ML)— you no longer have to maintain extract, transform, and load (ETL) pipelines to load files and transform data.
- You can avoid the expense and burden of maintaining multiple copies of large data files.
- You can be more targeted with consumption of data using BigQuery queries, improving performance, and compliance, and reducing cost.
Accessing the datasets
Google Cloud has been working with multiple industry firms on innovating in the market data space. By using Datashare for publishing, data publishers can make their entire datasets available on Google Cloud. Early adopters of Datashare include firms such as OneTick and Accern. OneTick’s datasets include reference and historical futures data (that can be accessed in our console with your login). Accern’s datasets include alternative data such as market sentiment and credit analysis data (that can be accessed in our console with your login).
To make it more helpful, we partnered with Accern to create a hypothetical scenario to describe the data acquisition and analytics process step-by-step.
Accern use case
As a sustainability analyst, you require an economic, social and governance (ESG) dataset to determine which sector is the most widely covered ESG sector by analysts, and to also identify the sector with the lowest ESG sentiment score. Now, you can discover and acquire an ESG dataset in Google Cloud.
Step 1. Navigate to the Financial Services solutions page in the Google Cloud console:

Step 2. Click a dataset, for example Accern AI-Generated ESG Insights, then review the overview details, plans and pricing, documentation and support information. To view the available pricing tiers, click ‘View All Plans’. Once you’ve decided on a tier that you would like to subscribe to, click ‘Select’, choose a billing account and review and accept the terms of service to complete the subscription. Once the steps are complete, click ‘Subscribe’ at the bottom. An overlay window will appear, click ‘Register with Accern’ to activate and complete the subscription.
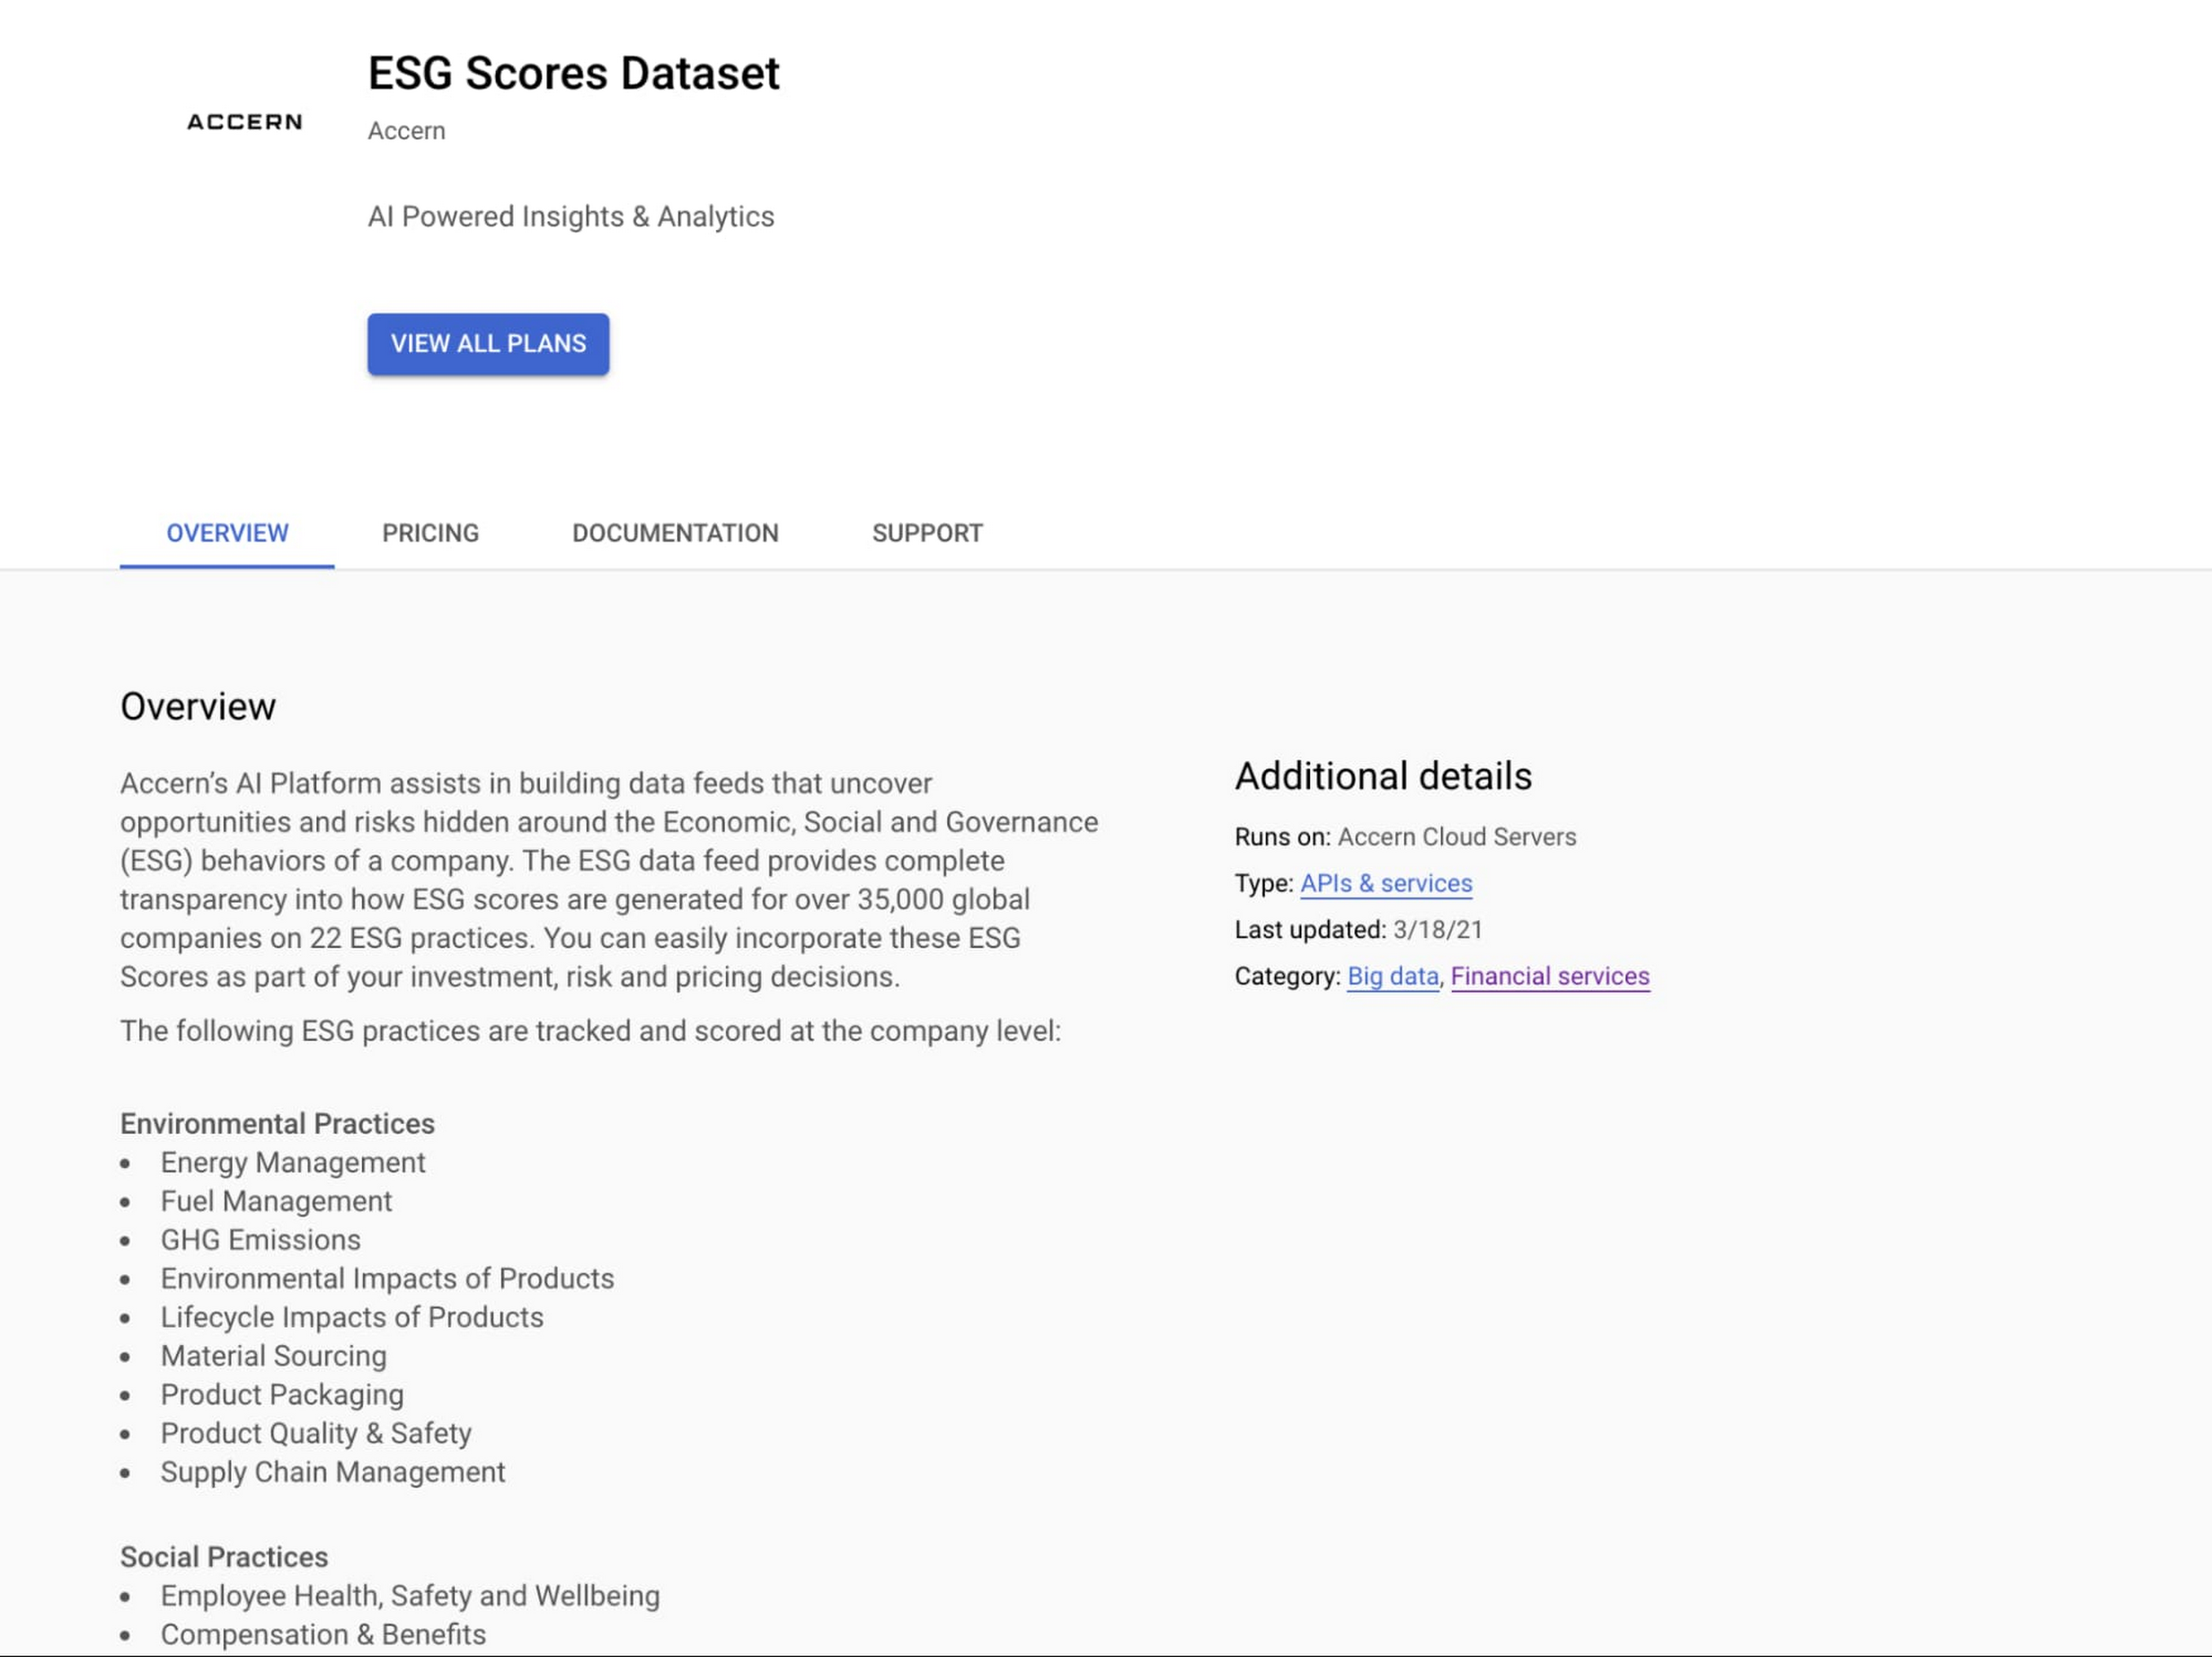

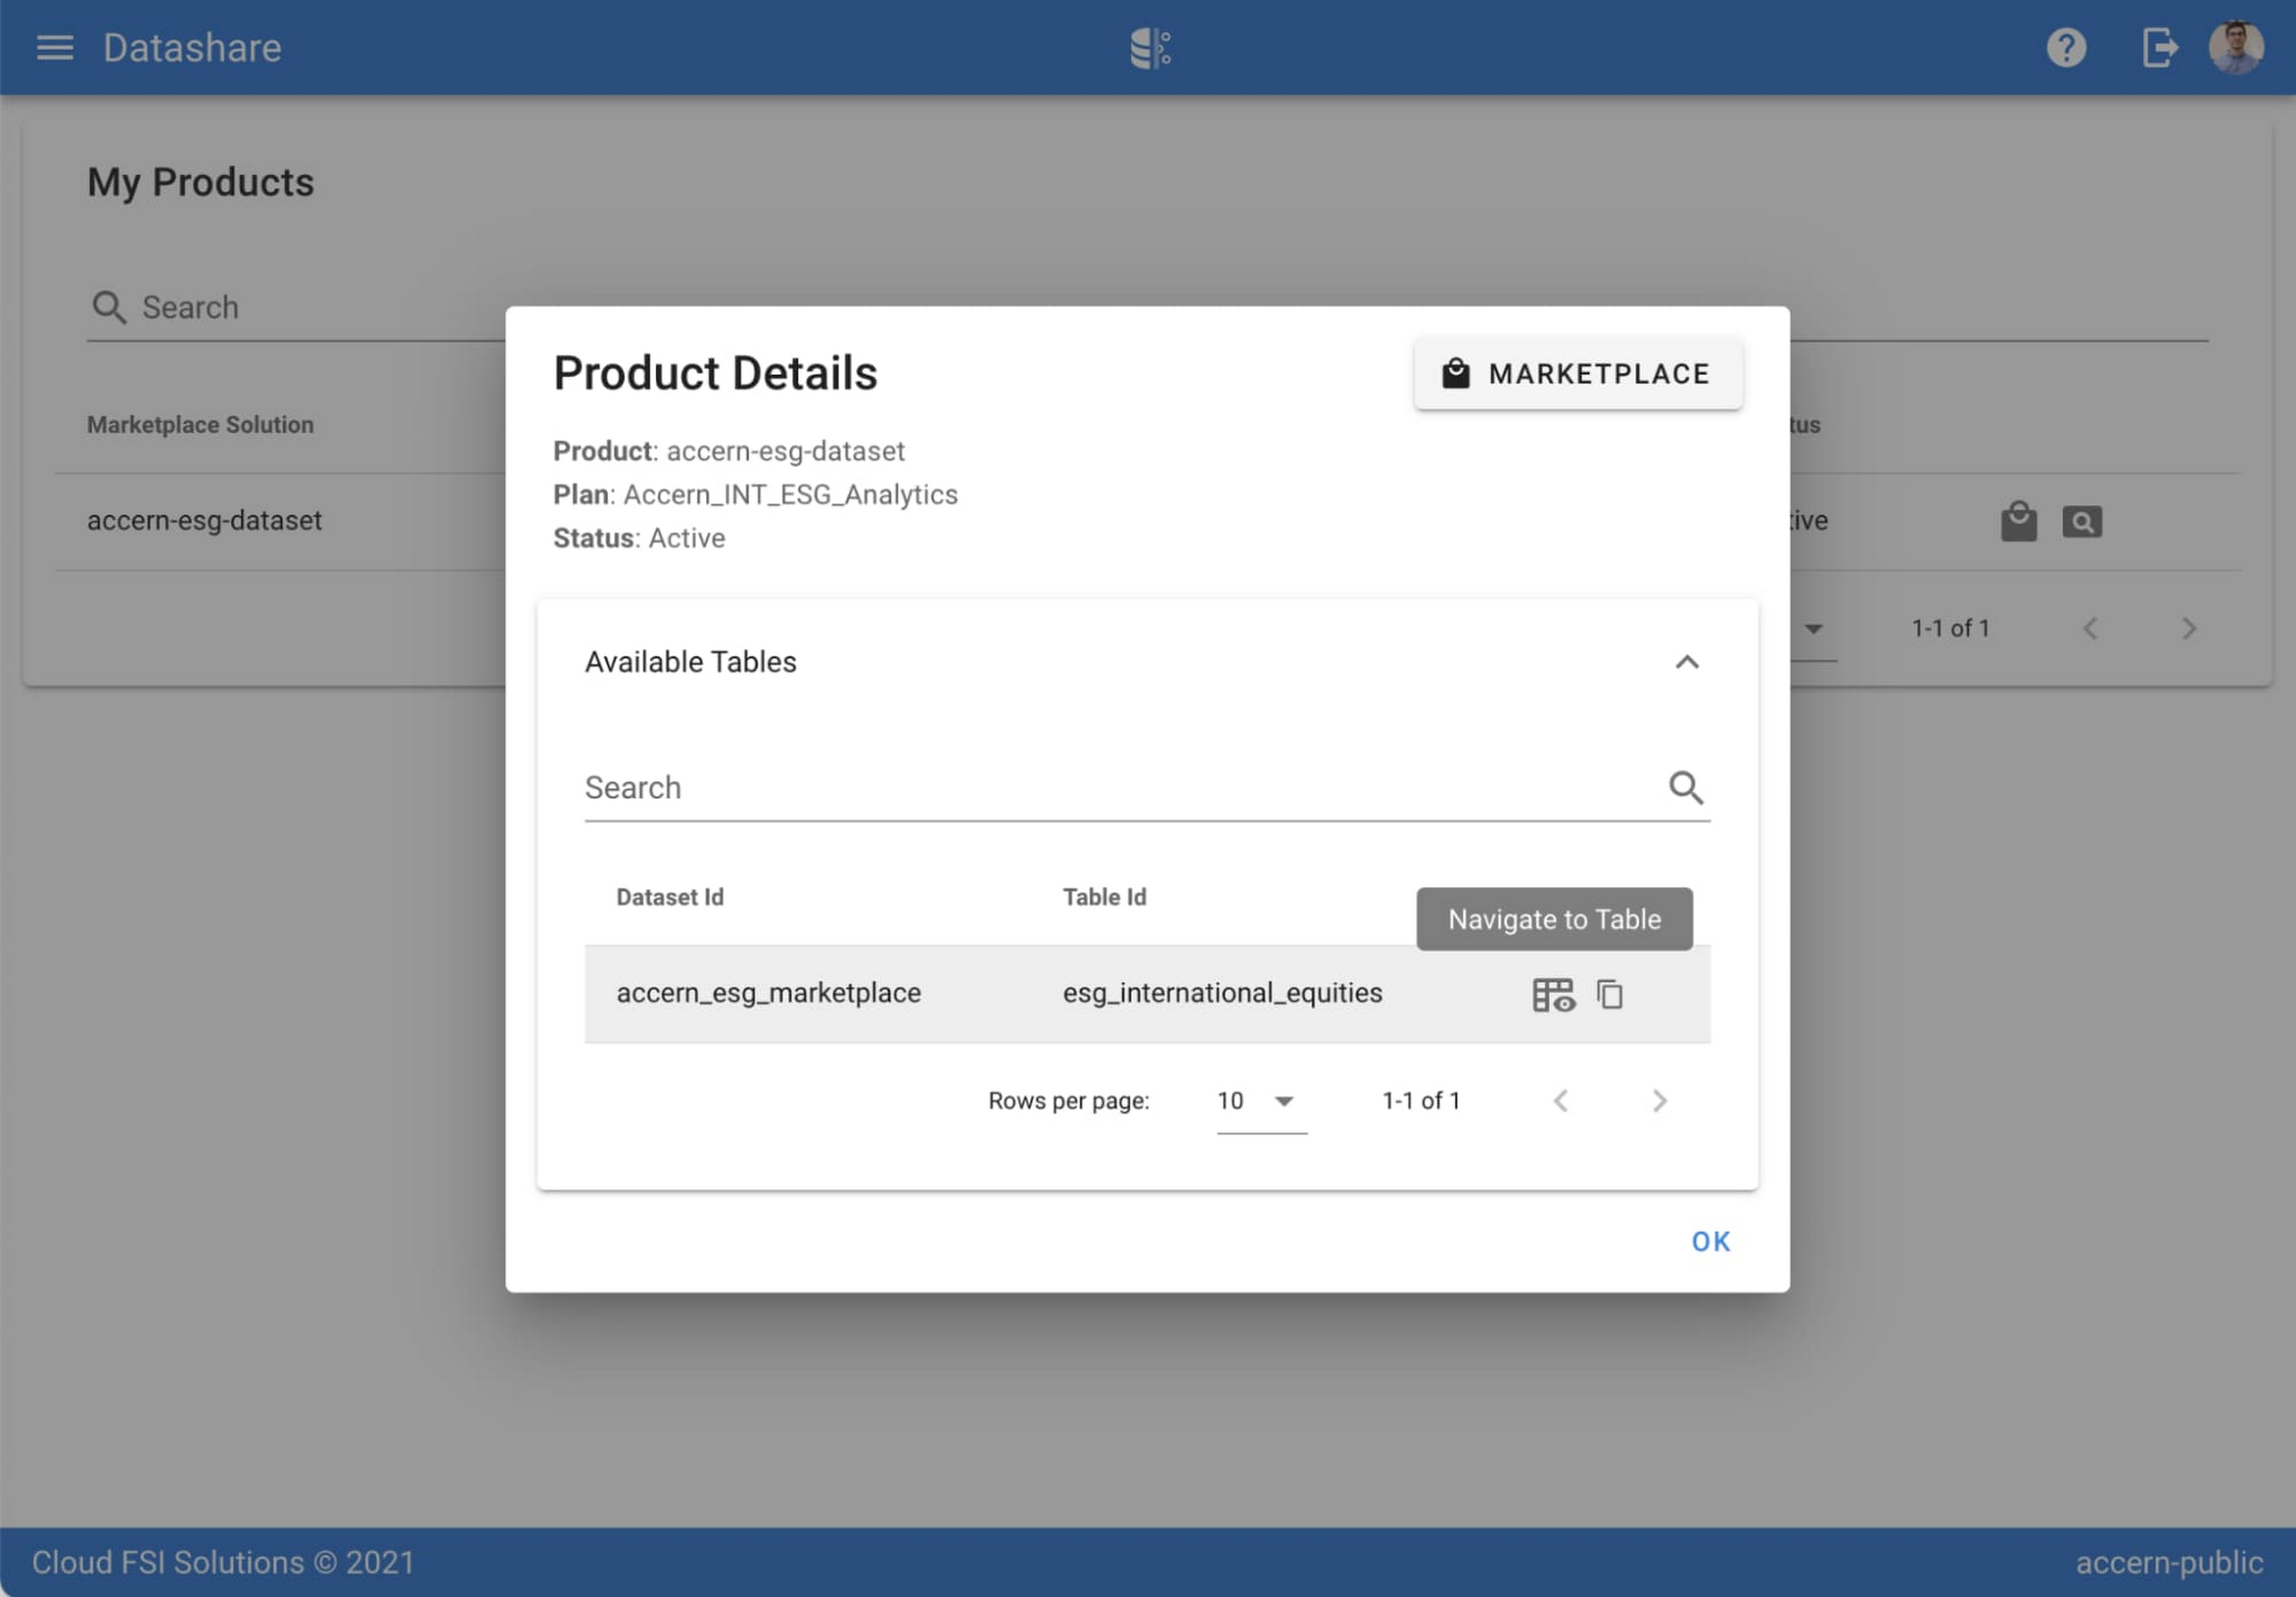
Step 3. Once activation is complete, you’ll be directed to the Datashare ‘My Products’ screen. Voila! You are now subscribed to Accern’s ESG Scores dataset and can access it in your Google Cloud instance using BigQuery. To access the data, click the hour glass icon on the corresponding ‘My Products’ record that you just purchased. An overlay will present you with the details on the dataset and/or table. Click the ‘Navigate to Table’ button to navigate through to the BigQuery console.


Step 4. Now that you have access and are in the BigQuery console, it’s time to generate data insights.
For this example, we’ve eliminated the company identifying information that is included as part of the subscription and aggregated company ESG in a view where each row represents a day, an industry sector, a specific identified ‘ESG Issues’ (event_group and event) and the respective ‘ESG Sentiment’ per issue.

For example, row 1 indicates that within the ‘Healthcare’ sector, there was a ‘Social – Civil Society’ issue identified and it had a negative ESG sentiment score of -15.35.
Step 5. Generate a report by exporting it to Data Studio to build visualizations and conduct additional analysis on the ESG data.
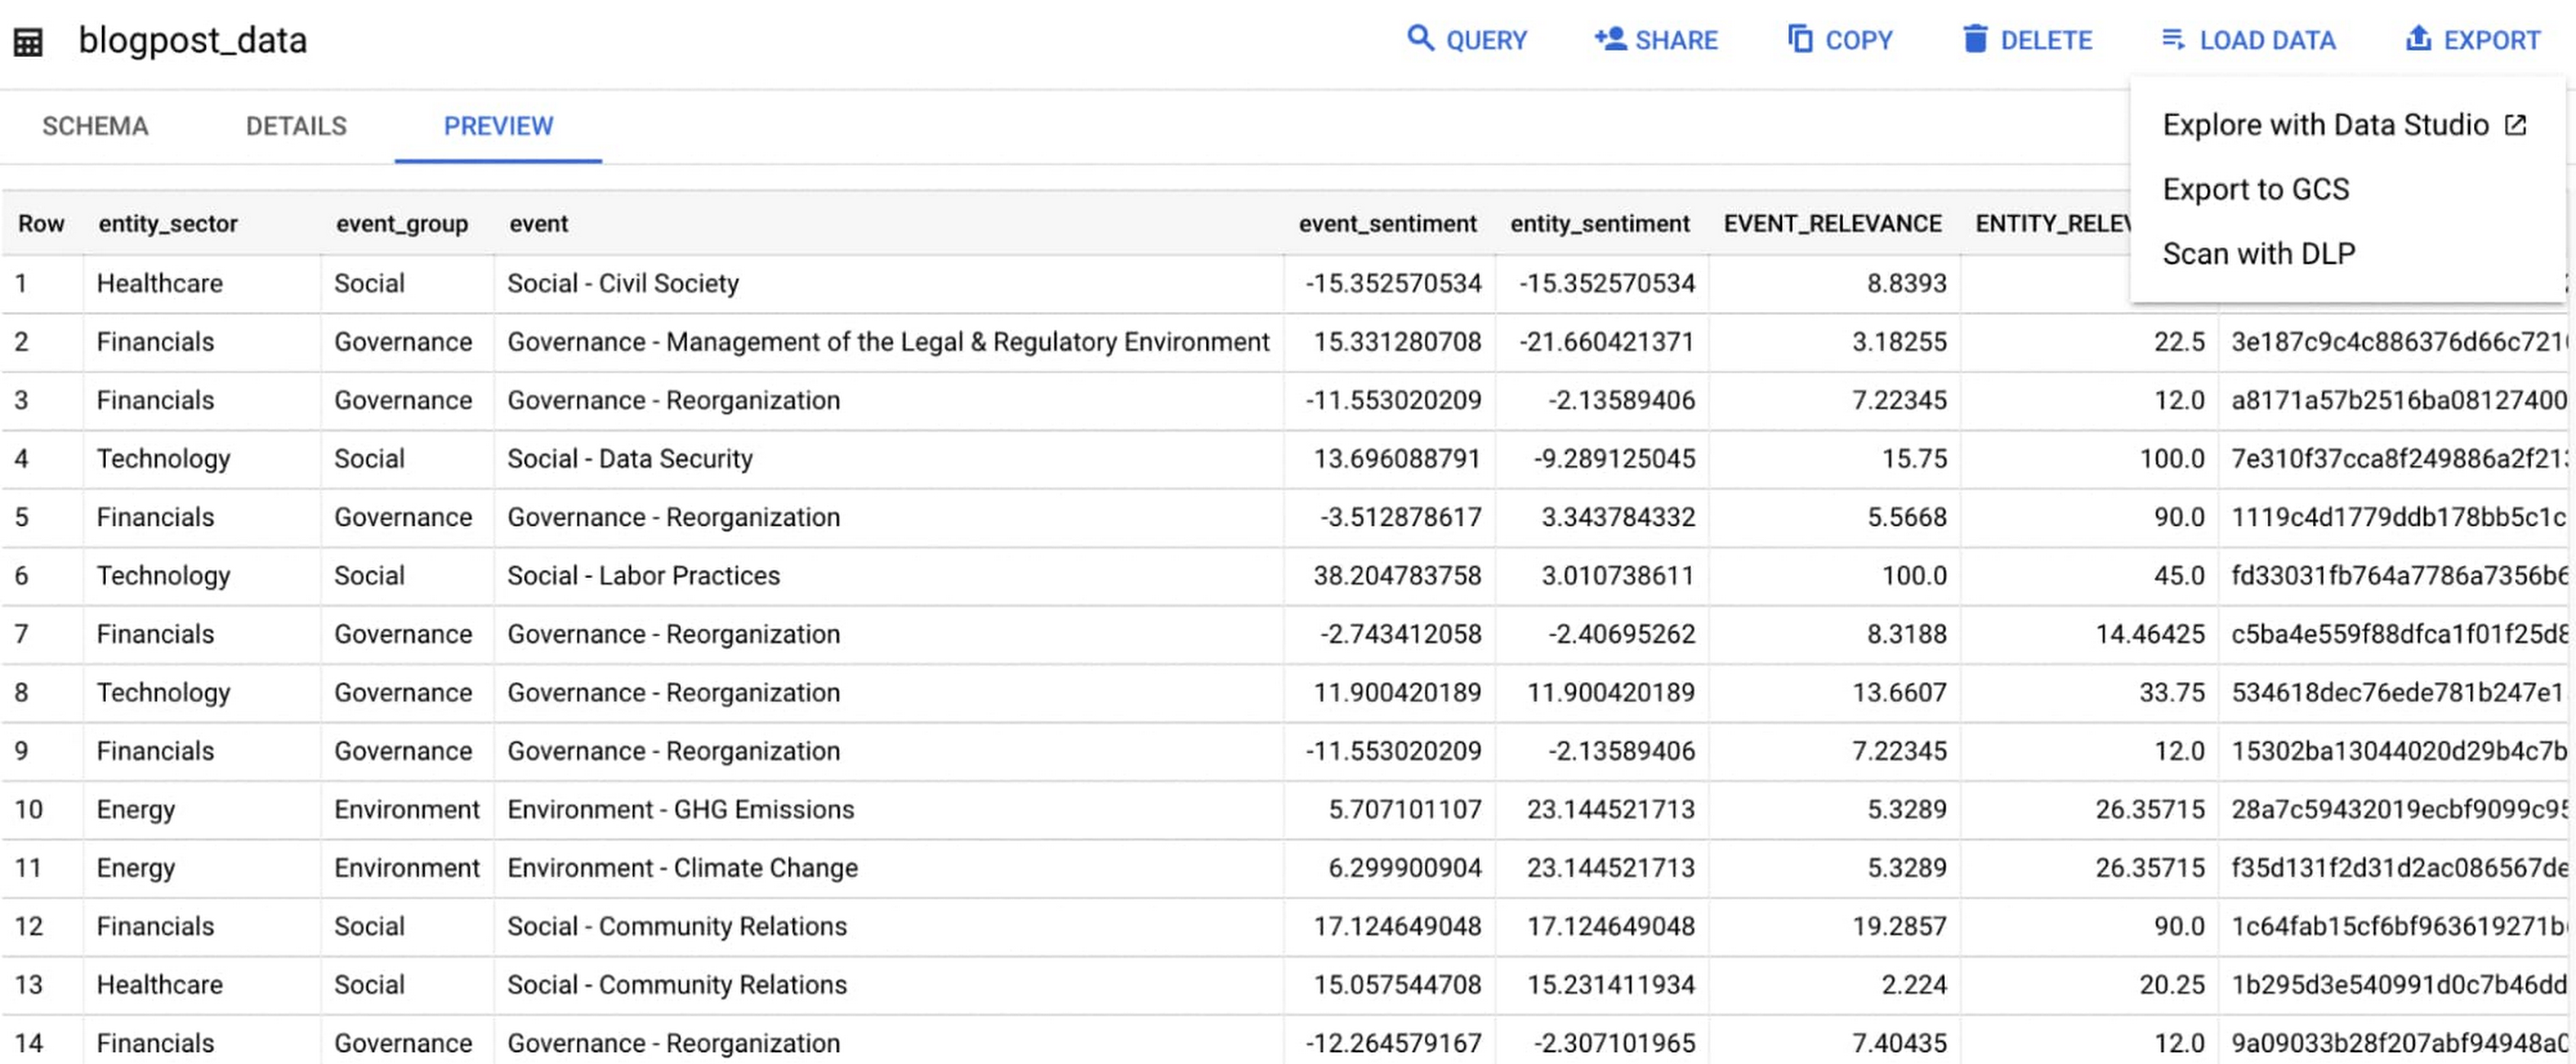
Select ‘Export’ and ‘Explore with Data Studio’.
Step 6. Build a simple/basic report.
Now that the ESG data appears in Data Studio, you can start by building a simple chart to help you understand which industry sectors have the highest volume of discussions around ESG and the overall ESG Sentiment per industry sector.
To build the chart:
- Select the chart type ‘Table’.
- Include
Entity_Sectoras your dimension to aggregate results by ‘Industry Sector.’ - Include
Signal_IDas a measure to count the number of ESG passages identified per ‘Industry Sector.’ - Include
AVG(Event_Sentiment)as a measure to display the overall ESG Sentiment per ‘Industry Sector’ across ESG Issues.

You can see sectors that are most discussed when it comes to ESG related topics and their corresponding ‘ESG Sentiment’ scores.
Step 7. Build your final report in Data Studio.
As a next step you can further drill into the data to understand ESG data specific to each ‘Industry Sector’ and identify positive and negative ESG practices.
Accern has built a more complex sample dashboard and made it available publicly here. You can interact with this report and play around with the data. The dashboard can help to identify material ESG insights for each sector to inform your investment and risk processes. If you have additional questions, you can reach out to Accern directly.

Discovering, accessing and analyzing licensed datasets is quick and easy. Stay tuned for more updates on new licensed datasets.
Publishing your data via Datashare
If you are a publisher of market data, alternative, or exotic data, you can use Datashare to get it published on Google Cloud Marketplace.
Start by joining the Partner Advantage program by registering for the Partner Advantage Portal and applying for the Partner Advantage Build Model engagement. Visit our getting started guide for information to get started on publishing licensed datasets in the Marketplace. Stay tuned for a future blog post about using Datashare to publish datasets in the Marketplace.
More solutions for capital markets
Check out other Google Cloud solutions for capital markets.

Google Leads the Pack in Big Data NoSQL Market: Forrester Research
DOWNLOAD RESEARCH REPORTS4142
Of your peers have already downloaded this article
2:30 Minutes
The most insightful time you'll spend today!
NoSQL has become critical for all businesses to support modern business applications. It has gone from supporting simple schemaless apps to becoming a mission-critical data platform for large Fortune 1000 companies. It has already disrupted the database market, which was dominated for decades by relational database vendors.
Today, half of global data and analytics technology decision makers either have implemented or are implementing NoSQL platforms, taking advantage of the benefits of a flexible database that serves a broad range of use cases.
Analyst firm Forrester Research in its recent report has named Google Cloud a leader in the Big Data NoSQL market as it supports a broader set of use cases, automation, good scalability and performance, and security offerings.
Download this Forrester Research report to understand why enterprises are turning to NoSQL and why Google Cloud is a leader in this space.

Le Figaro Uses Google Firebase to Personalize Experiences and Generates 3X Revenue Results
DOWNLOAD CASE STUDY8285
Of your peers have already downloaded this article
1:45 Minutes
The most insightful time you'll spend today!
Le Figaro, established in 1826, is France’s oldest and largest daily morning newspaper. The company’s mission is to provide timely, digestible and engaging news to their readers. As one of the first in the industry to offer digital content, Le Figaro engages their subscribers across 11 Android, iOS and web apps that cover news, sports, lifestyle and games. Le Figaro has about 22M monthly active users on their mobile and web apps and 120K paid digital subscribers.
The Challenge
In a saturated news app market, Le Figaro was looking to increase paying customers and to retain existing paid subscribers. To do this, Le Figaro’s development team needed to engage readers with personalized content at the right price point, but how could they pull it off with limited time and resources?
The Solution
Le Figaro used a number of Firebase products to retain existing users and increase paid subscriptions. They sent targeted notifications through Firebase Cloud Messaging reminding customers to follow topics and journalists they found interesting. This helped reduce churn by keeping subscribers engaged in content they valued. They also tested different subscription amounts using Firebase A/B testing, which helped Le Figaro identify the price points that led to the highest number of conversions among both Android and iOS users.
“Using Firebase has completely transformed Le Figaro’s digital business by making it easy to rapidly innovate and personalize content for our readers. With Firebase we have seen continuous increases in retention, downloads and screen time in our apps!”
Valentin Paquot, Mobile CTO, Le Figaro
Le Figaro found their biggest increase in paid subscriptions came from embedding real time interactive infographics into their mobile and web app articles. When a user added information into the infographic, it triggered a Cloud Function that accessed data stored in Cloud Firestore and returned a personalized infographic to the user in real time.
For example, in the article “Are you rich?” readers could input their income into the infographic and compare it against different income groups in Paris instantaneously. The infographics was behind a paywall and users had to subscribe to gain access.
According to Le Figaro, this infographic saw 3X the rate of paid subscription sign-ups compared to their other infographics. The team built this interactive infographic system in 3 days instead of their average time of 2-3 weeks using a traditional backend service. Using Cloud Functions and Cloud Firestore, they estimate they were able to reduce development time by 86%.
ActivStat: Enhancing Live Sports Broadcast with Real-time Stats and Metrics

5086
Of your peers have already read this article.
2:00 Minutes
The most insightful time you'll spend today!
Millions of people annually view esports, as top players and teams compete in thrilling, fast-paced tests of reflexes, strategy, and teamwork. Fans are a diverse group, sharing a passion for action. A new, revolutionary project we’re working on with Call of Duty League just made that action a lot better.
ActivStat brings fans, players, and commentators the power of competitive statistics in real-time—stats that matter not only to the game at hand, but also for a full roster of competitors globally. Using ActivStat, live broadcasts will soon be enhanced with more depth and color-of-play while they’re happening, building excitement and adding to the overall experience.
Technically, ActivStat is an entirely new capability for esports. It’s a constantly updating catalog of statistics that is sourced, analyzed, updated, and delivered in an easy-to-consume way across global-scale computing systems, with a latency of milliseconds or seconds, rather than minutes or hours. By comparison, many of these stats today are available to fans after a day or more of processing.
Call of Duty League plans to begin rolling out ActivStat during the 2021 season. The initial rollout will include critical information like player and team standings and winning ratios across multiple aspects of virtual combat—including ultimately what these numbers mean for rankings. ActivStats are delivered both in raw statistics and via visualizations and graphics, providing commentators with fast access to the types of insights fans crave.
For engineers at both companies, building the service has been an epic success all its own. Due to a sponsorship with Call of Duty signed last February, our dedicated game engineering team quickly innovated a new solution incorporating high-speed networking, data pipelines from multiple cloud sources, and data warehousing to create a user-friendly dashboard. Real data was flowing into commentator dashboards by April.
Esports are more complex to cover in many ways than regular sports. Instead of a well-defined physical playing field (often a simple rectangular space), multiplayer games involve complex and sprawling virtual environments that can be the size of a large campus or airport with multiple levels and hidden locations.
Gameplay between competitors happens across many of these locations simultaneously. In addition, competitors also each choose their own configurations of equipment, known as “loadouts,” which can dramatically affect gameplay and strategy. All of this additional complexity in online gaming involves data that needs to be captured, analyzed, and communicated to the fans in insightful ways.
Two Google Cloud technology capabilities play central roles in the operations of ActivStat. BigQuery—a planet-scale data warehouse that can store and query petabytes of information in real time—is the foundation of the ActivStat platform for gathering and summarizing millisecond-level statistics. Looker, an intuitive analytic dashboard, surfaces those insights to commentators in an easy-to-use, real-time dashboard that enables the commentators to speak to compelling insights and statistics in sync with the gameplay as it is happening in the live broadcast.
While the initial release of ActivStat for this season of Call of Duty League provides compelling and powerful capabilities, it’s only the beginning of this Call of Duty League-Google Cloud co-innovation partnership. Our future vision is mapping gameplay hotspots on the field, and predicting where to place cameras with machine learning as the match evolves–enabling broadcast producers to build excitement for fans by always being in the middle of the best action. Call of Duty League and Google will also look to drive statistics and metrics directly into the broadcast feed.
The implications of the real-time statistical capabilities of ActivStat go beyond gaming and esports. Historically, gaming has been at the leading edge of what computer processing, computer graphics, wide-area networking, data analysis, and insight can do. The real-time data ingestion and output used in ActivStat could one day be useful powering live broadcasts in other types of sporting events, as well as blending live video feeds and data to support use cases in media & entertainment, healthcare, finance, manufacturing, and other verticals. We’re excited about the potential for this bold new solution and partnership between Call of Duty League and Google in esports and beyond.
To learn more about Call of Duty League-Google Cloud partnership, visit our press release.
More Relevant Stories for Your Company

Renaulution: Renault’s story of migrating to 70 applications in 2 years
Editor’s note: Renault, the French automaker, embarked on a wholesale migration of its information systems—moving 70 applications to Google Cloud. Here’s how they migrated from Oracle databases to Cloud SQL for PostgreSQL. The Renault Group, known for its iconic French cars has grown to include four complementary brands, and sold

Groww’s Google Cloud-Powered Platform: The Key to Secure and Successful Investing
Groww makes investments simple and accessible, using Google Kubernetes Engine to ensure a reliable platform for customers, and makes data-backed decisions to grow its business with BigQuery. Google Cloud results Reduces hardware costs with Preemptable Virtual Machines Enables a lean DevOps team with Google Cloud Analyzes data effectively and quickly

Updating Twitter’s Ad Engagement Analytics Platform for the Modern Age
As part of the daily business operations on its advertising platform, Twitter serves billions of ad engagement events, each of which potentially affects hundreds of downstream aggregate metrics. To enable its advertisers to measure user engagement and track ad campaign efficiency, Twitter offers a variety of analytics tools, APIs, and

Vodafone Leverages Google Cloud to Aid COVID-19 Frontline with Anonymized Insights on Population Mobility
Editor’s note: When Europe’s largest mobile communications company, Vodafone, was asked by the European Commission to help understand population movement across the European Union and the UK to help fight COVID-19, it was able to provide anonymized mobile network-based insights to answer the call. Here’s how Vodafone, with the support
